

Beyond the Box Score: Why Advisors Should Consider the Pain Ratio Alongside the Sharpe Ratio
Jun 05, 2026True baseball fans know that a batting average only tells part of the story. A hitter who goes 1-for-4 every single game and a hitter who goes 0-for-12 for three games and then collects four hits in one afternoon can end a month with the same average. But their respective teams — and their managers — will tell you the experiences were nothing alike. The three-day drought mattered. The anxiety mattered. The rally that had to be built from scratch mattered. In our view, the same logic applies directly to how investors should evaluate an investment manager.
Most financial advisors are familiar with the Sharpe Ratio, and for good reason — it is one of the most widely cited measures of risk-adjusted performance in the investment industry. But we believe it should not be evaluated in isolation. Rather, when considered alongside the Pain Ratio, the two statistics together can provide a far more complete picture of what it feels like to invest with a given manager over time.
The Sharpe Ratio: Reward Per Unit of Risk
As illustrated below, the Sharpe Ratio is defined as a portfolio's annualized excess return over the risk-free rate divided by the portfolio's annualized standard deviation. In plain terms, it answers the question: for every unit of total volatility a manager introduces, how much excess return are investors receiving? A higher Sharpe Ratio indicates a more efficient trade-off between risk and return.
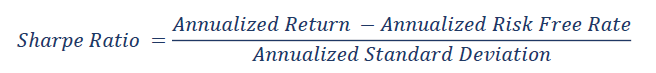
The Sharpe Ratio is powerful precisely because it penalizes volatility on both sides — upswings and downswings alike are captured in the standard deviation denominator. A manager who produces strong returns with wild gyrations in both directions will see their Sharpe Ratio compress. And therein lies the limitation.
Standard deviation treats an up 10% month and a down 10% month symmetrically. But as any investor who has lived through a significant drawdown will tell you, those two events are emphatically not the same. Gains are welcome, whereas losses compound anxiety, test conviction, and — in the worst cases — prompt poorly timed redemptions that permanently impair wealth. The Sharpe Ratio is indifferent to the direction of the volatility it measures. But the Pain Ratio is not.
The Pain Ratio: Reward Per Unit of Drawdown Risk
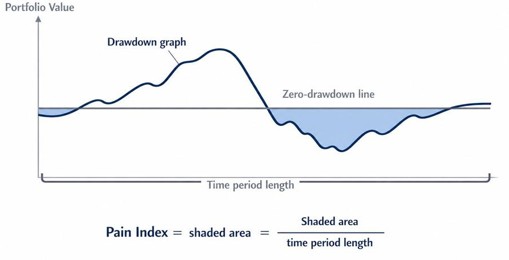
Developed by Zephyr®, the Pain Ratio begins with the concept of the Pain Index, a statistic that captures the frequency, depth, and duration of a manager's drawdowns simultaneously. Unlike maximum drawdown — which is a single snapshot of the worst peak-to-trough decline — as illustrated in the theoretical scenario below, the Pain Index represents the area enclosed by the drawdown graph and the zero-drawdown line, divided by the length of the time period analyzed. Think of it as measuring the total "below water" experience of a portfolio over its history.
Created by ChatGPT
Let’s consider two managers with an identical maximum drawdown of 15%. The first manager fell quickly, recovered within a few months, and spent most of the period at or near new highs. The second manager spent years grinding slowly lower before recovering. A maximum drawdown statistic would treat these two managers identically. The Pain Index would not — and appropriately so. The second manager inflicted far more investor "pain" over the measurement period.
The Pain Ratio, as illustrated below, then takes the Pain Index as the denominator — in the same structural way as the Sharpe Ratio uses standard deviation — and divides it into a manager's annualized excess return over the risk-free rate.

A higher Pain Ratio indicates that the manager is delivering more excess return for each unit of realized drawdown experience. It rewards managers who generate consistent upside while minimizing how long, how deep, and how often they leave investors in the red. In our view, this is a much more honest proxy for the actual lived experience of a long-term investor than standard deviation alone.
Why Advisors Should Consider Both
The Sharpe Ratio and the Pain Ratio answer different questions. The Sharpe Ratio asks: how efficiently is a manager converting total volatility into excess return? The Pain Ratio asks: how efficiently is a manager converting actual investor hardship — the drawdown experience — into excess return? A manager can score well on one and poorly on the other.
Imagine a manager with low volatility overall, but a tendency to endure long, slow drawdowns from which recovery takes years. Their standard deviation might look modest, producing an acceptable Sharpe Ratio. But investors who allocated capital at the peak may wait a very long time to see positive returns — whereas the Pain Ratio would reveal that burden. Conversely, a manager with higher headline volatility but swift recoveries and infrequent drawdowns may have a Pain Ratio that presents a more favorable picture than the raw volatility story told by the Sharpe Ratio.
We caution against evaluating any single statistic in isolation. The purpose of holding both ratios in view simultaneously is to identify managers who earn their returns not just on a volatility-adjusted basis, but on a drawdown-adjusted basis as well. We believe a manager who scores well on both deserves a strong measure of confidence. And a manager who scores well on one but poorly on the other warrants a much closer look at the nature of the risk being taken.
What the Numbers Say
The table below presents the risk-adjusted return statistics for MAP’s flagship composites compared to their respective benchmarks.
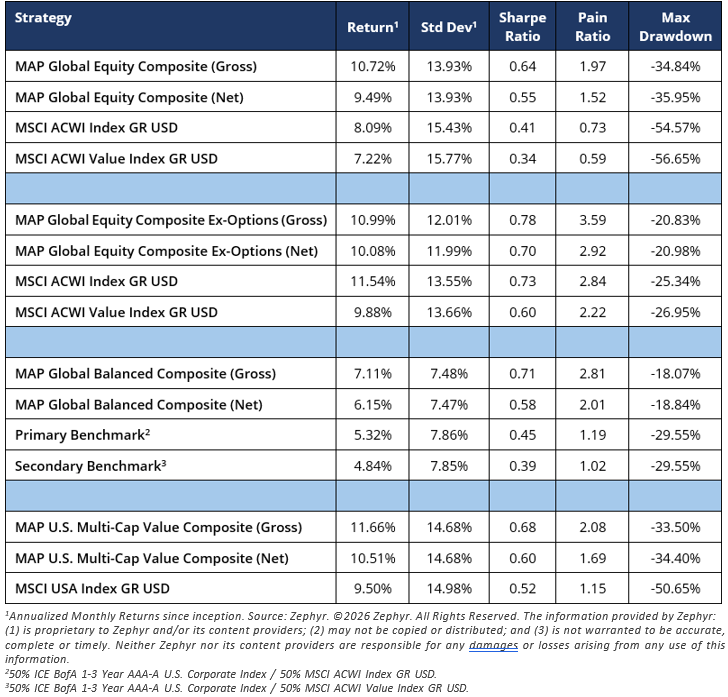
On a gross basis, MAP’s composites have historically produced a meaningful difference in risk-adjusted efficiency as measured by the Sharpe Ratio. For many investors and consultants, that differential would end the conversation.
But the Pain Ratio tells a significantly more powerful story. For every unit of drawdown experience endured by an investor in the above composites, the excess return delivered was more than what their respective benchmarks provided per unit of their own drawdown experience.
So, what accounts for the divergence between the Sharpe and Pain Ratio? The answer lies in how MAP’s portfolios are constructed. We continue to believe that protecting capital during major drawdowns is just as important as capturing upside. Compared to their benchmark’s, MAP’s composites have exhibited meaningfully shallower declines. Importantly, on average, those declines have been shorter in duration. Less time spent below the high-water mark translates directly into a lower Pain Index even when the returns themselves have been only modestly higher.
The Sharpe Ratio, relying on standard deviation, does not fully capture this distinction. A composite with a lower standard deviation than its benchmark may earn a higher Sharpe Ratio, but it does not specifically reward the shorter, sharper nature of the drawdown experience. The Pain Ratio does. We believe this is precisely the kind of nuance that matters most to long-term investors, particularly those who depend on portfolio income or those who have experienced the behavioral costs of watching an account sit below its high-water mark for an extended time period.
The Problem with Institutional Databases
Several leading wealth management database platforms highlight the Sharpe Ratio as the north star for evaluating every investment manager. We believe that although the Sharpe Ratio is a key risk-reward measure, evaluating a manager too heavily on one metric misses the bigger picture. MAP’s portfolios are built with multiple risk-reward measures in mind. We seek to generate competitive returns while minimizing the frequency, depth, and duration of drawdowns — not simply to produce attractive statistics, but because we believe that sustainable wealth creation requires investors to stay invested through full market cycles. A portfolio that causes its clients to abandon their strategy at the worst possible moment is, in our view, not a good portfolio regardless of what its Sharpe Ratio says.
Please contact your MAP representative to continue this conversation or if you need any additional assistance.
Managed Asset Portfolios Investment Team
Michael Dzialo, Karen Culver, Peter Swan, Zachary Fellows, and Nicolas Vilotti
June 2026
The performance information contained herein is supplemental and complements the MAP Global Equity Composite, MAP Global Equity Composite Ex-Options, MAP Global Balanced Composite, and MAP U.S. Multi-Cap Value GIPS® Reports and quarterly Fact Sheets and Strategy Overviews. For Investment Professional Use Only. No investment decision should be made solely on the basis of the information reflected in this Thought Piece. This information does not constitute, and should not be construed as, investment advice or recommendations.
Certain statements made by us may be forward-looking statements and projections which describe our strategies, goals, outlook, expectations, or projections. These statements are only predictions and involve known and unknown risks, uncertainties, and other factors that may cause actual results to differ materially from those expressed or implied by such forward-looking statements. The information contained herein represents our views as of the aforementioned date and does not represent a recommendation by us to buy or sell this security or any other financial instrument associated with it. Managed Asset Portfolios, our clients and our employees may buy, sell, or hold any or all of the securities mentioned. Definitions and formulas were generated by Claude AI. We are not obligated to provide an update if any of the figures or views presented change.
MSCI data contained herein or delivered in connection with this notice (collectively, the “Information”) are copyrighted, trade secrets (when not publicly available), trademarks and proprietary property of MSCI Inc. or its subsidiaries (collectively, “MSCI”), MSCI’s licensors, direct or indirect suppliers and authorized sources, and/or any third party contributing to the Information (collectively, with MSCI, the “Information Providers”).

