

Navigating A World Drowning In Debt
Nov 12, 2021Qualitative Interpretation of Quantitative Data
Over the many years we have worked together, the investment team of Managed Asset Portfolios has developed some unique tools that help us parse out what is most relevant in our infinitely complex global economy. When we identify a theme that is persistent, pervasive, and thoroughly supported by evidence, we refer to it as a “thematic filter.”
We believe these thematic filters steer us away from systemic headwinds and allow us to concentrate our deep fundamental research efforts where there is the most opportunity. They are a valuable byproduct of our thorough study of the global markets. They influence our decisions across all of the portfolios we manage.
One of our thematic filters relates to how countries use or abuse government debt. This article discusses the rationale for our approach and the United States’ current indebtedness and outlook as an example of a debt-addicted country. Spoiler alert: though we aren’t panicking about the U.S. markets, we’re becoming increasingly concerned about our government’s debt addiction and its potential to put a damper on economic growth and valuations.
The Relationship Between Government Debt and GDP
Judicious borrowing can be a positive. Ideally, countries borrow to invest in needed infrastructure or other services that facilitate future growth. Borrowing can fund education initiatives, shipping ports, or even a land acquisition such as the Louisiana Purchase, all of which can boost the long-term growth of a nation’s gross domestic product.
Unfortunately, there comes the point where additional debt is less productive or, worse, counterproductive and irresponsible. As debt service payments demand ever-higher proportions of nations’ budgets, governments become increasingly limited in their abilities to fund new programs that support long-term economic growth or social stability. They may have to take austerity measures that can lead to depression, political upheavals, or both. Though it’s rare for large countries to default on their debt, it happens, as seen in Greece (2015),Russia (1998), and Latin America (the late 1980s).
That leads to the question of what level of debt starts to lead to negative consequences. It’s a popular topic for economic researchers. Though findings across studies predictably vary, a debt-to-GDP ratio in a range between 60-90% starts to trigger some counterproductive effects. A 2010 World Bank study found that the tipping point is a ratio of 77% public debt to GDP. This threshold is important because researchers also generally confirm that the relationship between debt levels and growth is nonlinear. As noted above, at lower levels, debt is associated with higher growth rates. Beyond that “tipping point”, the growth rate declines, with some studies finding that for every additional percentage point of indebtedness, GDP growth slows by one-eighth to one-tenth of a percent.
U.S. Debt Continues to Climb
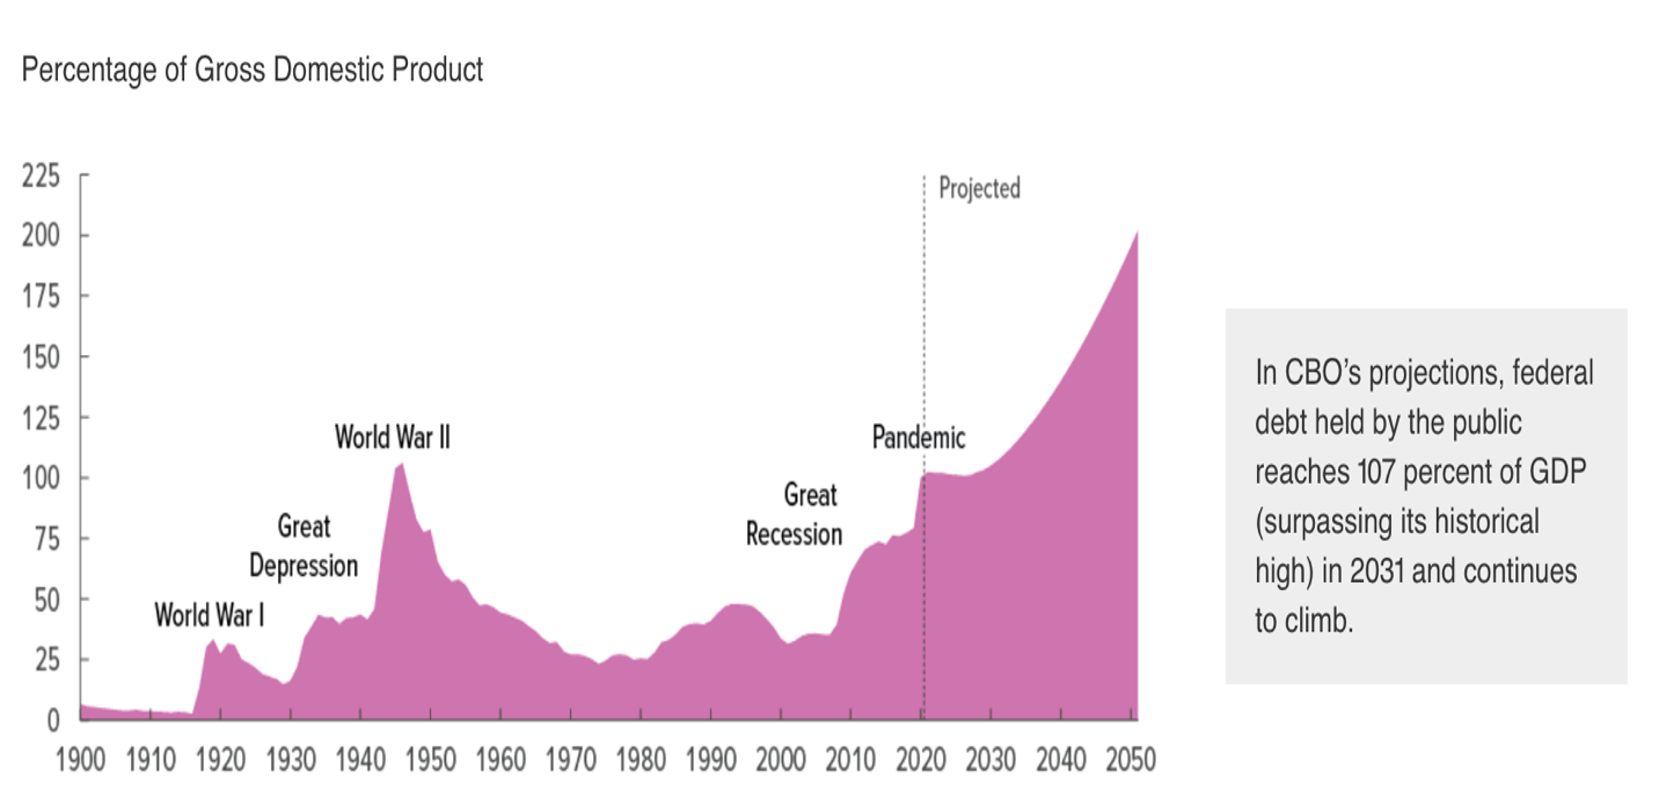
The United States, unfortunately, provides us with an example of poor fiscal discipline. The Congressional Budget Office currently projects that U.S. publicly held debt would be 102% of gross domestic product at the end of 2021. It further forecasts that debt will reach a historical high of 107% GDP in 2031 and exceed double GDP in thirty years. Below is a graph from the CBO that illustrates the historical relationship between debt and GDP in the United States.
Consider the impact of growing government debt in President Biden’s FY2022 budget. Debt service is currently expected to be 5% of the budget in 2022, but is projected to more than double to 11.1% in the next twenty years. In 2049, debt service would be the third-largest budgetary outlay after Social Security and Medicare.
Should those astronomical debt service levels materialize, the U.S. government will find it challenging to fund critical areas such as infrastructure, defense, and other social spending. We’re also skeptical of the CBO’s low projected borrowing cost of 3.5%, which is close to the historical average yield of the 10-year Treasury note. Considering the additional debt supply and a slowing economy, we find it easier to imagine a scenario where interest rates will be significantly higher, with even more dire implications for the U.S. economy.
What Drives Excessive Borrowing?
Why, then, do some countries persist in piling on debt? The answer may lie in short-term political thinking. Officials facing reelection or reappointment may find it politically convenient to provide benefits without the downside of raising taxes. But, once granted, those programs are sticky, making them difficult to cut.
Then there is the market side of the equation. After nearly a decade of quantitative easing, market participants have become pacified by the flow of liquidity provided by the Fed. While a limited sample size, the only time the Fed tried to reduce its balance sheet, the market had a tantrum. The S&P 500 experienced a peak to trough decline of nearly 18% in 2018, forcing the Fed to reverse course in March 2019.
We believe many countries will continue to kick the can down the road by refinancing and adding to their current burdens. Countries facing debt service pressures have tools at their disposal to avoid intermediate default, such as intragovernmental transfers and managing interest rates. However, these may likely have negative impacts over the long term.
MAP’s Approach
Because of short-term political incentives that reward deficit spending, we don’t expect highly indebted countries to reverse course, at least not in our immediate future.
A simplistic approach would be to avoid countries that don’t follow fiscally responsible policies. But we see that as too restrictive. We believe attractive opportunities can be found anywhere, even in highly indebted countries. So, rather than allowing debt levels to dictate where we invest, we consider their effects at the company level. If we believe the country’s debt levels negatively impact GDP growth, we might lean towards defensive companies or innovative firms that aren’t as dependent on the country’s economic direction. That helps us avoid exposure to governments’ poor fiscal discipline without dramatically restricting our global opportunity set.
This is but one example of how Managed Asset Portfolios develops unique insights into the global markets. If you’d like to learn more about our process and our team, please don’t hesitate to contact your MAP Representative.
Managed Asset Portfolios Investment Team
Michael Dzialo, Karen Culver, Peter Swan, John Dalton and Zack Fellows
November 2021
Certain statements may be forward-looking statements and projections which describe our strategies, goals, outlook, expectations, or projections. These statements are only predictions and involve known and unknown risks, uncertainties, and other factors that may cause actual results to differ materially from those expressed or implied by such forward-looking statements. The information contained herein does not represent a recommendation by us to buy or sell any security or securities. Managed Asset Portfolios, our clients and our employees may buy, sell or hold any or all of the securities mentioned. We are not obligated to provide an update if any of the figures or views presented change. Past performance is no guarantee of future results.

