

MAP Views Third Quarter 2023
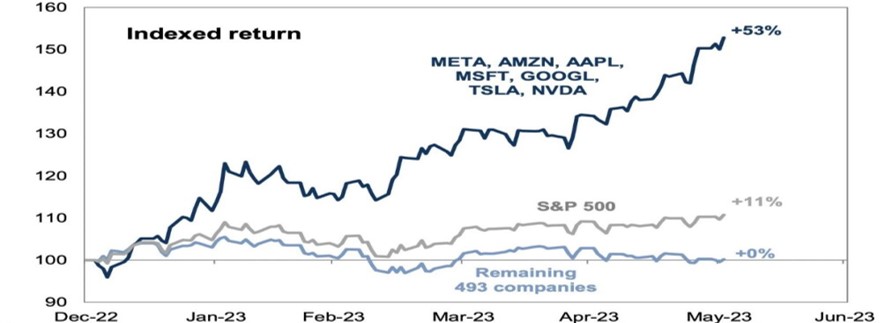
Jul 06, 2023The first half of 2023 was a bifurcated one for the broader markets. Headline numbers for the broad indices posted impressive double-digit returns; however, a handful of large-cap technology stocks drove these returns. This was most evident in the Nasdaq Composite which was up 32.3% for the first six months of the year, its best start since 1983. Highlighting the impact of technology stocks on various indices, the S&P 500 was up only 16.89%. Driving that return were the "Magnificent Seven" (Amazon, Apple, Alphabet (GOOG/GOOGL), Meta, Microsoft, NVIDIA, and Tesla which returned an average of 66.67% and accounted for 73.8% of the S&P 500’s return. While returns were most bifurcated in the month of May (in the first five months of the year, absent returns from the Magnificent Seven, the remaining 493 stocks had a near break-even cumulative return), June showed some broadening market depth. Similar dynamics drove the performance of the MSCI ACWI index, up 14.29% year-to-date, as both indexes have the same top 7 holdings. Given the larger constituency of the ACWI, however, the positive impact of the Magnificent Seven on total performance wasn’t as pronounced as it was in the Nasdaq Composite and S&P 500.
Now with all that data in mind, it’s important to remember that even with the strong start to the year, we have still not reached the prior peak in any of these indices. We think this is a critical point because it demonstrates the level of returns that you need to get back to breakeven if you do not manage your drawdowns. Markets reached peak valuations in 2021 which left them exposed to sharp drawdowns when the market dynamics changed. While we are not saying we are there yet, valuations at the index level are already above their historical averages and are reaching levels they were at in 2020/2021. This implies that growth needs to reach a level larger than is currently expected or interest rates need to decline. Both of which are heavily exposed to the economic environment and cause us to tread carefully before jumping into this rally headfirst.
Source: Goldman Sachs, FactSet
The largest contributor to the outsized returns of the Magnificent Seven was investors’ enthusiasm around the opportunity for Artificial Intelligence (AI). While we believe AI has an abundance of potential, we believe the AI investing environment today is reminiscent of the internet stocks during the dot.com bubble of the 1990s. One only needs to look at the Bloomberg news references to AI relative to those of the Internet during the 1990s to draw a comparison between the two, as both escalated significantly as a percentage of overall Bloomberg news stories during their early days. This creates both opportunities, as well as risks, for investors.
The Internet created a lot of opportunities for investors, but inflated expectations and lofty valuations also led to the bursting of the dot-com bubble. Indeed, many of the key players in the AI space today have better business models than companies embroiled in the dot.com mania; however, valuations of some AI stocks appear stretched at current levels. NVIDIA (NVDA) is a perfect example. The company has executed many things correctly and certainly seems to be at the right place at the right time, but at more than 40 times trailing twelve-month sales per share and 22 times forward sales per share, there doesn't seem to be much room for error.
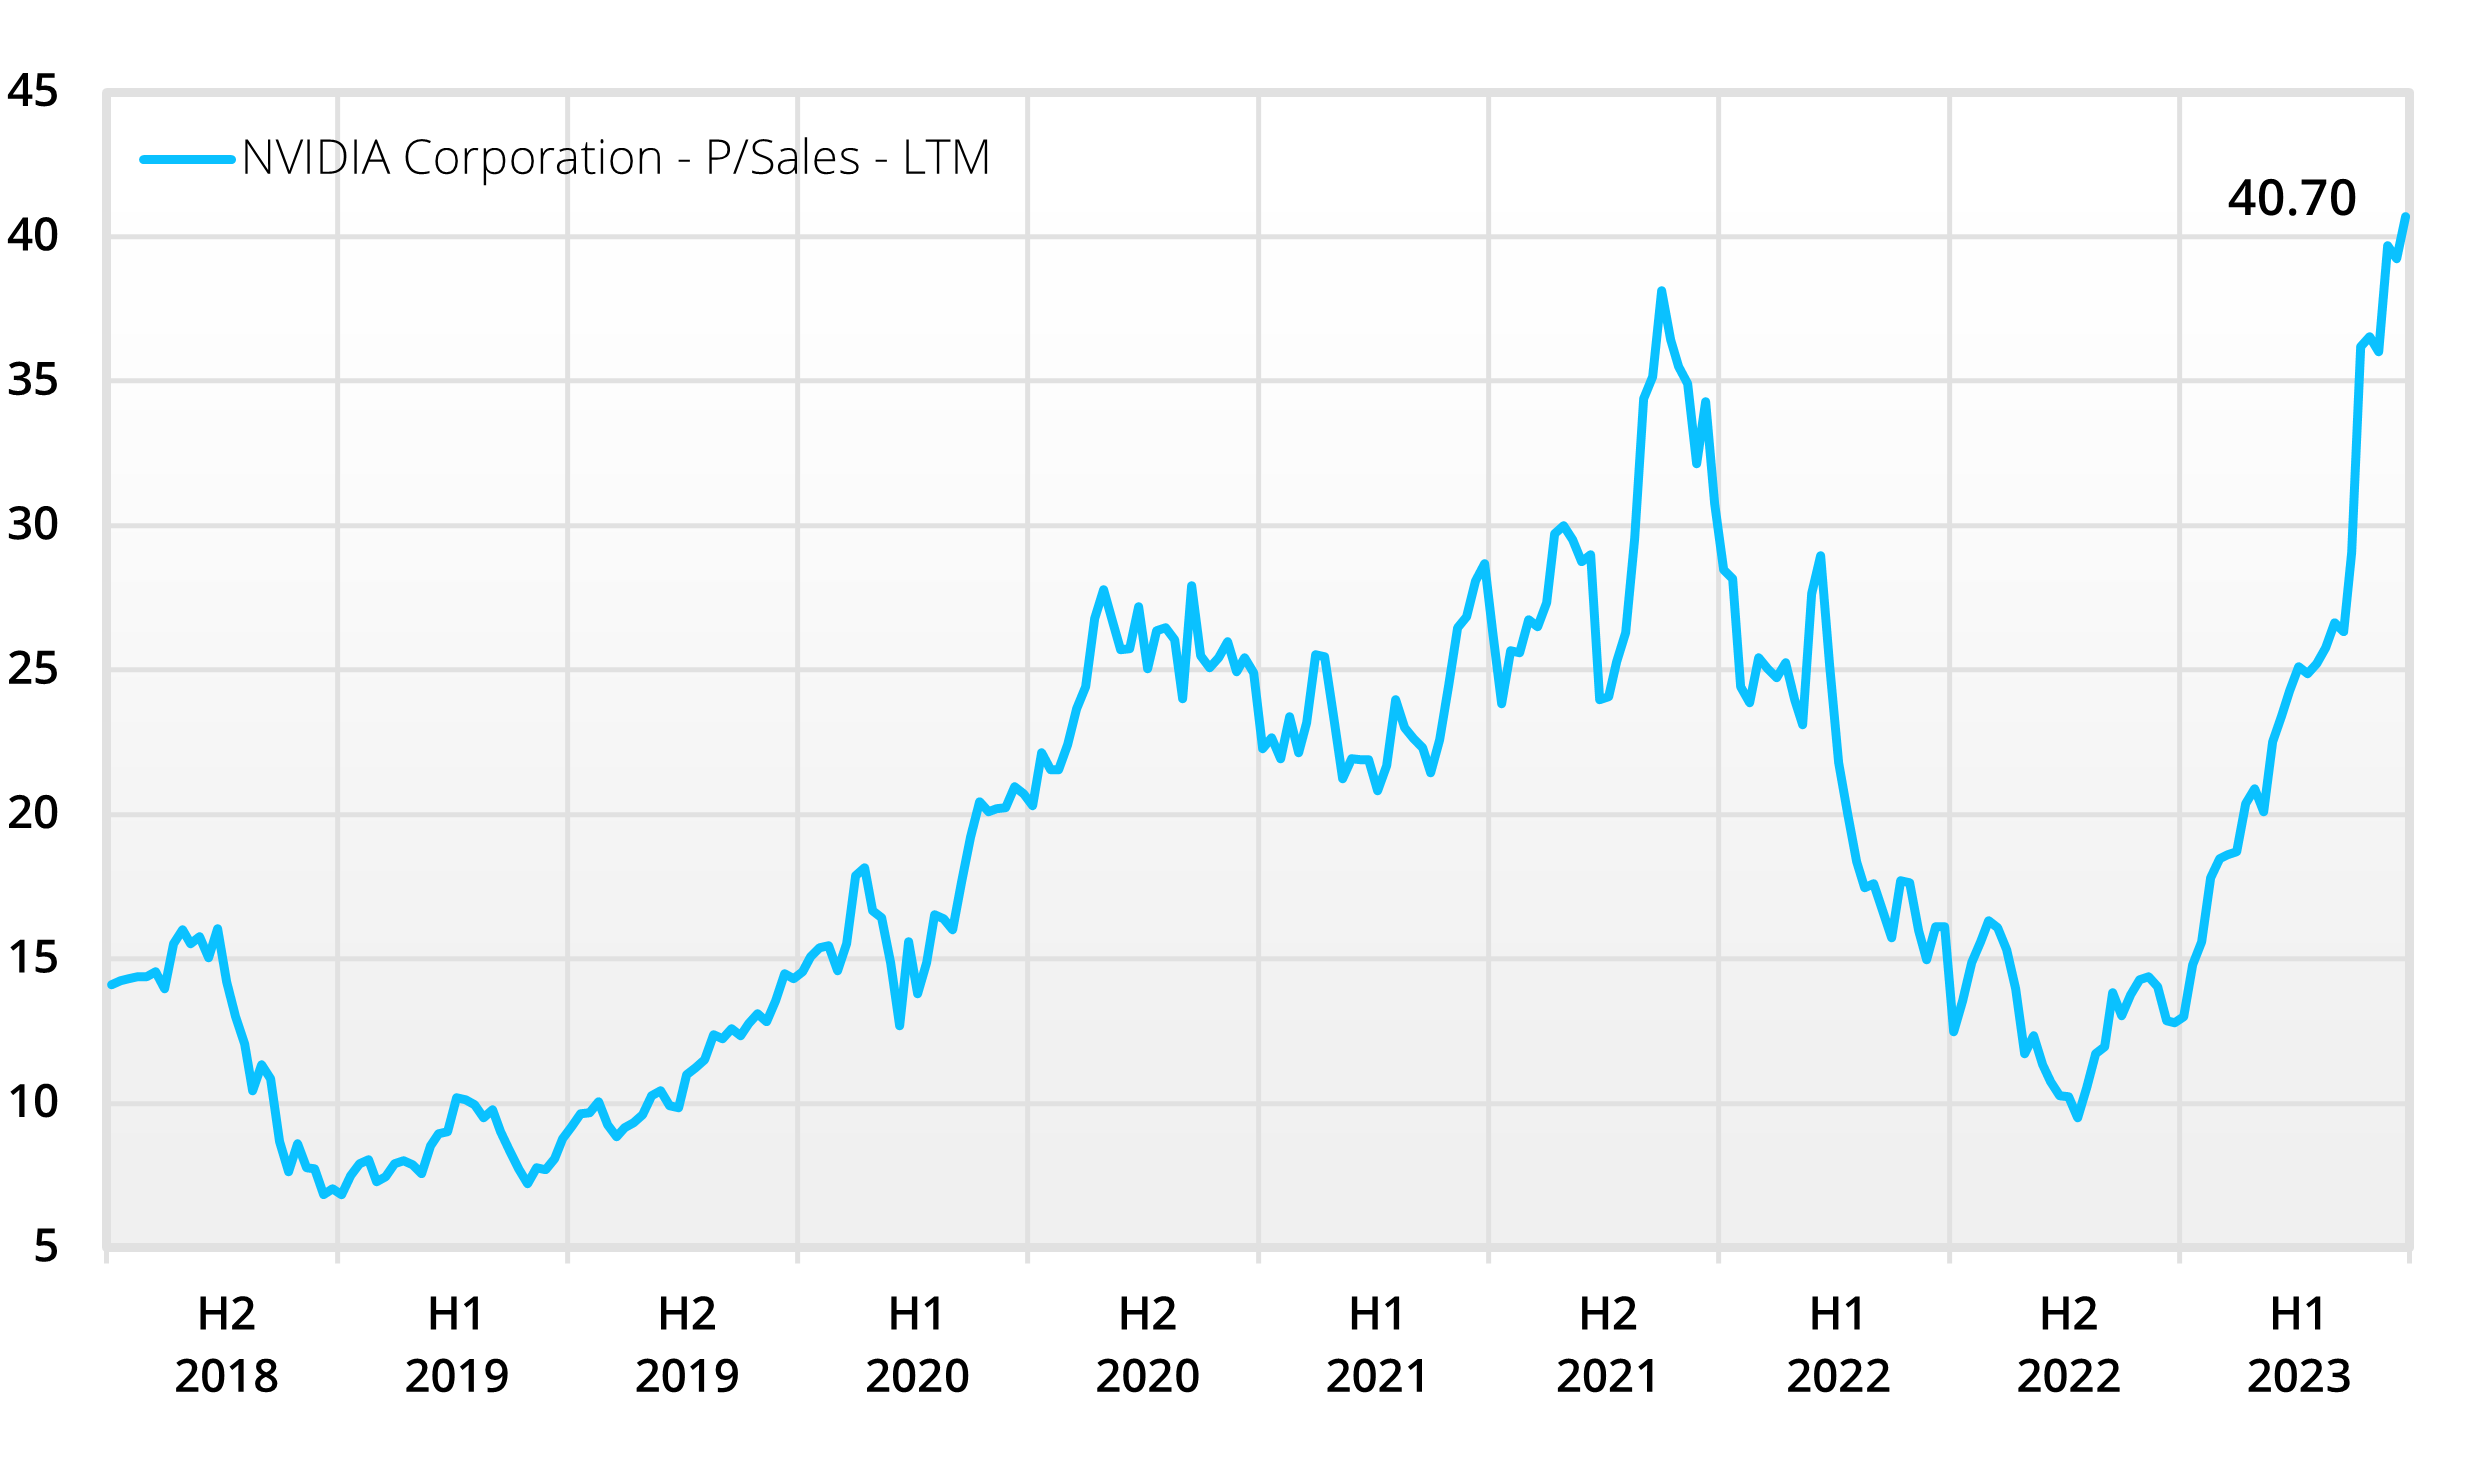
Source: FactSet as of June 30, 2023.
So far this year, corporate results have exceeded expectations. Some of these gains can be attributable to the fact that many companies have been able to successfully pass along higher costs to consumers. However, somewhat alarmingly, profits have also been aided by some companies adopting looser accounting practices. A recent study published in the Journal of Financial Economics found that the aggregate Beneish M-score for U.S. companies was at its highest level in 40 years. The Beneish M-score is a mathematical model that utilizes eight financial ratios to identify potential earnings manipulation. While elevated readings don't necessarily signal a market top, high readings have historically coincided with tops of economic cycles and therefore suggest that investors exercise caution.
There remains considerable debate about the Federal Reserve’s actions for the second half of 2023. While headline inflation numbers have dropped substantially from where they were a year ago as supply chain constraints stemming from the COVID-19 pandemic have largely been resolved coupled with the Fed’s tightening action, it remains well above the Fed's stated two percent target. Additionally, sticky inflation (dubbed so because even as prices in the U.S. come down for items such as food and energy, they remain elevated for services such as airfares, rent, and education) remains little changed from its peak. This is due to the fact that sticky inflation responds slowly to changing economic conditions. With that said, it seems that everyone on Wall Street is a momentum player these days. Since inflation has been trending lower for the past year, many investors believe it will continue downward until it reaches the Fed's target. We are skeptical of that belief and contend it will be more difficult to bring inflation down from its current five percent level to the Fed’s two percent goal than it was to lower it from the nine percent plus to where it is currently.
As we have stated previously, we believe the Fed is between a rock and a hard place in terms of fulfilling its two official mandates (stable prices and full employment) as well as its unofficial mandate (stabilizing markets during periods of financial duress). Historically, Fed tightening cycles have resulted in breakage of financial markets. The 1929 and 1987 crashes occurred while the Fed was tightening, as did the 2001 recession, and the Great Financial Crisis of 2008, among others. Most recently, the Fed’s tightening actions resulted in the failures of Silicon Valley Bank (SVB), First Republic Bank (FRB) and Signature Bank, as well as the ultimate sale of Credit Suisse to UBS Group AG in the first quarter of 2023, as rising interest rates and jittery depositors pressured banks with extended maturity bonds on their balance sheets. Against this seemingly treacherous backdrop and with some economic indicators, such as those related to manufacturing, signaling a lackluster economy, we question if the Fed will hike rates twice more this year, despite their implied pledge to do so.
While a downturn appears possible, our economic views remain much the same. We expect growth will be hard to come by, hence our continued overweighting towards the consumer staples (which people tend to buy regardless of economic strength) and healthcare sectors (which should benefit from a post-pandemic recovery). We own the technology sector selectively, as we do have high expectations for AI. We also believe select names in the materials sector should benefit from persistent inflation. We emphasize that our material stocks (such as Freeport (FCX) and Mosaic (MOS)) each have catalysts, such as an increasing need for copper stemming from a projected increase in demand for electric vehicles, and fertilizer as farmers try to increase yield in a volatile global climate environment.
Turning to the fixed income environment, today, the yield on the two-year Treasury is over 100 basis points more than that of the 10-year Treasury. This is the greatest degree of inversion since 2000. Given that our longer-term inflation forecast is in the 3 – 5 percent range, we do not see the attractiveness of longer-term bonds and continue favoring shorter-term maturities. We have taken advantage of the stress in the banking system by purchasing Certificates of Deposit (CDs) (predominantly with one-year maturities). Many of these brokered CDs provide yields similar to that of corporate bonds but with a government guarantee (we keep all purchases under FDIC coverage thresholds).
In closing, we would like to thank everyone for allowing us the opportunity to manage your assets. It is a responsibility we do not take lightly. We work diligently every day to deliver the best risk-adjusted returns possible. We wish everyone a safe, relaxing, and enjoyable summer season.
Managed Asset Portfolios Investment Team
Michael Dzialo, Karen Culver, Peter Swan, John Dalton, and Zachary Fellows
July 2023
Certain statements made by us may be forward-looking statements and projections which describe our strategies, goals, outlook, expectations, or projections. These statements are only predictions and involve known and unknown risks, uncertainties, and other factors that may cause actual results to differ materially from those expressed or implied by such forward-looking statements. The information contained herein represents our views as of the aforementioned date and does not represent are commendation by us to buy or sell this security or any other financial instrument associated with it. Managed Asset Portfolios, our clients and our employees may buy, sell or hold any or all of the securities mentioned. We are not obligated to provide an update if any of the figures or views presented change.

