

MAP Views Fourth Quarter 2025
Oct 01, 2025The third quarter highlighted the difficult predicament the Federal Reserve Board (“the Fed”) is facing. As we alluded to in MAP Views last quarter, U.S. employment data weakened, lending support to the argument in favor of lowering interest rates, while inflation remained above the Fed’s 2% target, supporting the case for keeping interest rates steady. With data in hand, the Fed opted to lower the Fed Funds rate by 25-basis points at its September meeting. Investors, anticipating a cut, pushed stock and bond prices higher during the quarter. In contrast, the U.S. dollar weakened to its lowest level relative to a basket of currencies year-to-date. And in its 26-year history, the euro is off to its best 9-month start of the year versus the dollar. We believe the weakening dollar trend will remain intact, especially if the Fed continues to lower interest rates, while inflation remains elevated.
We believe this 25-basis point cut is unlikely to be a ‘one and done’ event for the Fed. Additional cuts are probable through 2026, as the Fed surrenders to political pressures amid an economy that should not be labeled as robust. How many cuts are on the table remains unknown as the Fed’s own projections show committee members lacking a consensus following their most recent meeting.
Recent GDP revisions show a picture of a stronger than expected economy, with first half of 2025 growth in a 2% range. However, we caution investors to look beyond the headline numbers. The U.S. economy has become quite bifurcated, with the top 10% earners accounting for more and more of the economy, while low-income consumers continue to face pressure. Looking forward, we would not be surprised to see an economic boost from the stimulus of the “Big, Beautiful Bill” and the economy reaping the rewards from a more favorable regulatory environment. However, an uptick in the economy, coupled with lower interest rates and the continued impact from tariffs are likely to keep inflation at elevated levels. In fact, recent data suggests we may see inflation rise heading into 2026. Many companies stockpiled inventories ahead of the April 2nd “Liberation Day” and many took further advantage of the 90-day tariff pause to add supplemental inventory. As these pre-tariff goods are sold out of inventory, we believe prices are likely to experience an uptick.
Barring a major economic decline (which we note is not our baseline forecast), we do not see a path towards the Fed’s 2% inflation target. Ultimately, it will become increasingly difficult for the Fed to justify an extended string of cuts in the face of stubborn inflation readings, despite their recent mandate changes. Rather, we think the Fed will eventually begin to part ways from its 2% target, as the government is likely to favor the economy running “hot” to help grow the nation out of the enormous debt dilemma we are facing. In fact, we would not be surprised to see 3% become the new 2%. Bear in mind, however, that just because the Fed cuts interest rates does not necessarily imply that yields will move lower across the yield curve. The Fed cut rates prior to the November elections last year, and again after the election. Yet yields on bonds with longer dated maturities actually increased.
Investors who have parked their assets in money market accounts, Treasury Bills, Certificates of Deposits (CDs), and other similar vehicles have begun to see those yields move lower and will likely see that trend continue as the Fed takes rates lower. For portfolios managed with fixed income holdings, the Investment Team has slightly increased the maturity of purchases over the past couple of quarters in anticipation of lower rates. We remain leery of longer-dated bonds, given that the duration risk those bonds carry is greater than we are willing to accept.
As a vivid example of how duration risk can take a toll on long term bonds when interest rates rise, let’s examine a bond that Apple issued in 2020. The bond offers a 2.55% coupon and matures on August 20, 2060. Since rates have risen since the issuance, this bond now trades at less than 60 cents on the dollar, down nearly 40% from its issuance price.
The chart below shows how well foreign stocks have performed year-to-date relative to U.S. stocks. But what is even more striking is the difference between the Sharpe Ratios (a measurement of risk-adjusted returns). The Sharpe Ratio of the MSCI ACWI World Ex-USA Index is 2.24, compared to the Sharpe Ratio of the S&P 500 of 0.84.1,2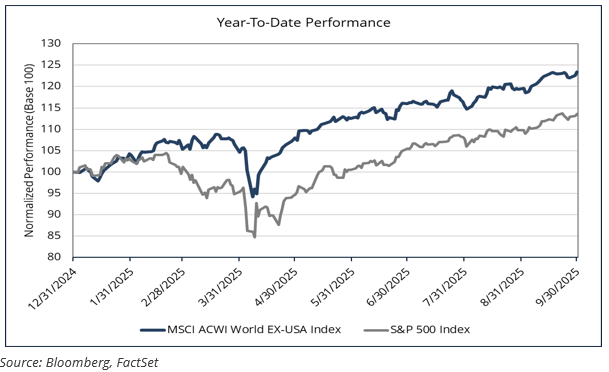 The Investment Team’s next thought piece published later this quarter will detail why we believe the U.S. dollar has further to fall and how portfolios have been positioned to take advantage of this continuing trend while sidestepping some of the investment risks we see developing as well. While we are encouraged by the strong nominal performance of our portfolios this year, we remain focused on delivering clients a disciplined approach to global value investing, which we believe will help facilitate our goal of delivering the best possible risk-adjusted returns for clients.
Thank you for your continued trust and partnership and we look forward to building on this positive momentum as we close out the year and look ahead to 2026.
Managed Asset Portfolios Investment Team
Michael Dzialo, Karen Culver, Peter Swan, Zachary Fellows, John Dalton, and Nicolas Vilotti
1Data provided by Bloomberg as of 09/29/2025.
2The Sharpe ratio formula is (Portfolio Return – Risk-Free Rate) / Portfolio Standard Deviation. It measures an investment's risk-adjusted performance, with a higher ratio indicating better returns per unit of risk.
October 2025
Certain statements made by us may be forward-looking statements and projections which describe our strategies, goals, outlook, expectations, or projections. These statements are only predictions and involve known and unknown risks, uncertainties, and other factors that may cause actual results to differ materially from those expressed or implied by such forward-looking statements. The information contained herein represents our views as of the aforementioned date and does not represent are commendation by us to buy or sell this security or any other financial instrument associated with it. Managed Asset Portfolios, our clients and our employees may buy, sell or hold any or all of the securities mentioned. We are not obligated to provide an update if any of the figures or views presented change.

