

MAP Views: Fourth Quarter 2018
Oct 25, 2018Through the first nine months of 2018, the S&P 500 returned over 11% to investors, while the balance of the world saw declines of more than 5%. Optimism about a robust domestic economy, strong corporate earnings (spurred by lower tax rates) and investors’ embracing technology stocks (which make up about 26% of the S&P 500) all contributed to pushing U.S.stock prices higher. October has lived up to its reputation as optimism turned to pessimism with investors beginning to have concerns about the status of trade talks between the U.S. and China coupled with interest rates continuing to move higher. As of October 24th, the S&P 500 has lost 9.18% while the MSCI ACWI lost just over 9%.
On September 26, the Federal Reserve raised interest rates for the eighth time since the end of 2015. Despite this series of quarter-point hikes, the yield curve has become unusually flat. As of the end of last quarter, the difference in interest rates between two-year and ten-year Treasury Notes narrowed to 24 basis points. The yield curve merits watching because it has historically been a good predictor of economic downturns. An inverted yield curve has preceded nearly 90%of all recessions in the U.S. So far, this quarter’s earnings release season has been a mixed bag. More than a few companies have lowered forward guidance citing rising prices due to tariffs, and we question whether or not they will be able to be passed on to the consumer. iRobot, the maker of the Roomba, indicated they intend to eat the higher costs rather than raise prices. In the end, it is a lose/lose situation. Either companies eat the costs and face lower margins, or they raise the prices of their goods and potentially face lower revenues as consumers potentially reduce purchases.
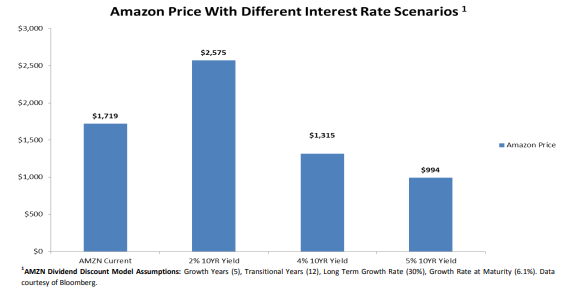
October’s sell-off could be easily attributed to investors realizing that the Federal Reserve was (and is) serious about raising rates. A given company’s stock value is simply its future cash flows divided by a discount rate. Regardless of how that discount rate is derived, it is always directly tied to interest rates. As the Federal Reserve continues to raise interest rates, the valuations placed on stocks should diminish. One should further note that in a rising interest rate environment, the prices of stocks whose cash flows are projected to be realized farther in the future (read growth stocks here), should be hurt more than stocks whose cash flows are projected to be realized in the near term. The disparity in performance is particularly acute if rates are rising from a low base. It is against this backdrop that one could explain why growth stocks fell dramatically more than their value counterparts did in last week’s market decline. Using a dividend discount model on a stock such as Amazon, we can see how taking the interest rate assumption for the 10-year Treasury from 2% to 4% or 5% can have a dramatic impact on the forecasted valuation of the stock price. Think back to the names that have carried the market for the past several years. The often-referenced FANG stocks (Facebook, Amazon, Netflix and Google (now Alphabet) come to mind. Let’s not forget about Tesla or the now high-flying cannabis stocks. All of these stocks and others moved to loftier valuations as investors embraced their business models and justified the higher stock prices. As value investors, we never adopted this process or drank the Kool-Aid.
There has no doubt been an explosion in investors embracing passive indexing over the last several years. We have found that this trend in indexing has resulted in stocks trading more in unison rather than on individual merits, at least on a short-term basis. Long-term investors can use short-term volatility to their advantage and buy good names at attractive prices as portfolio managers at index funds are forced to sell a given percentage of all their holdings (both good and bad) when their shareholders demand cash.
While we do not profess to be market timers, we would not be surprised to see the markets continue to be volatile in the coming weeks. Research is inconclusive as to whether spikes in stock market volatility accurately predict short-term market bottoms or tops. However, research has indicated that short-term spikes in volatility often lead to more volatility – and our portfolios are positioned accordingly. While no one can predict with much certainty what stock prices will do over the coming days and weeks, we maintain our belief that long-term wealth is created by adhering to a disciplined approach to value investing. Though fears over higher interest rates and trade wars may cause once complacent passive investors to flee the stock market, our portfolio team will actively seek out ways to take advantage of the displacement they are likely to cause.
Thank you for the opportunity to be of service to you. Please feel free to contact your MAP representative with any questions or concerns.
Sincerely,
Managed Asset Portfolios’ Investment Team
Michael S. Dzialo, Karen Culver, Peter Swan, John Dalton, and Zachary Fellows
October 25, 2018
Certain statements made by us may be forward-looking statements and projections which describe our strategies, goals, outlook, expectations or projections. These statements are only predictions and involve known and unknown risks, uncertainties, and other factors that may cause actual results to differ materially from those expressed or implied by such forward-looking statements.

