

MAP Thought Piece: Q&A With The Investment Team
Jun 27, 2022Navigating Behavioral Biases During Volatile Times
When the MAP Investment Team discusses topics for our thought pieces, we make sure to always stay true to our investment process. There are plenty of market prognosticators who perpetually spout bullish takes by viewing everything through rose-colored glasses; many of whom are currently shocked to find the S&P 500 in bear market territory. On the other end of the spectrum are the plethora of market strategists who constantly lean into the bearish factors permeating the market whenever they get the opportunity. At MAP, we approach our writing with the belief that our clients do not come to us to be optimistic or pessimistic, but rather for our honest, realistic thoughts on the markets and broader economy. We believe this realism has never been more suited than in the current market environment. For the first time since the COVID pandemic, but more so since the Great Financial Crisis, there is real fear in the market and the economy that the Federal Reserve (the Fed) will not be able to execute a soft landing with quantitative tightening and rising interest rates. Given all this uncertainty, coupled with the market environment of the past two years, we see investors of all shapes and sizes falling prey to some of the most pervasive behavioral biases that impact all of us.
As financial professionals, one of the most essential services we can offer to our clients is to help them navigate the emotional and cognitive biases that negatively impact the long-term performance of their portfolios. These biases influence investors in all stages of the market cycle. During a strong upswing in a bull market, investors tend to show bias to overconfidence, self-attribution, and recency bias, to name a few. As stock markets move higher, they attribute their success to their talent and nothing else, becoming overly confident in their decision-making while chalking up losses to outcomes that were beyond their control. As the market moves higher, they believe their most recent positive outcomes will lead to more positive results. However, once the market turns negative, those biases cause investors to be caught off guard and ill-prepared for an ‘undesirable’ market cycle. As losses accumulate, investors begin to display a new set of biases, such as confirmation, cognitive dissonance, anchoring, and loss aversion.
As we are sure many of our financial advisor partners know, it tends to be a similar story once the drawdown begins. Investors tend to gravitate toward information that proves their initial thesis while ignoring anything that might indicate they were wrong. With the market down even more, they become anchored to their original price or cost basis. They start making irrational arguments for the need to double down to breakeven or refuse to sell the position because they "know" it will get back to breakeven. Finally, they take the loss once they realize that their investment thesis is broken and returning to breakeven will not occur within a reasonable time frame. These investors become even more averse to future losses. Many of them can experience the “snake bite” effect, causing them to want to avoid nearly all risks and convert their portfolio entirely to cash or very conservative investments that do not fit their long-term life goals.
With that said, the focus of our current thought piece is not one of behavioral biases. Rather, it is to briefly touch on them in order to demonstrate their impacts during volatile times like these. In this thought piece, we will offer our analysis and opinions on many of the key inquiries we receive during our conversations with investors in hopes that you keep in mind the behavioral biases that drive them.
Will The Market Decline Accelerate?
This is one of the most critical questions we have received recently, and as many financial professionals are aware, it is tough question to answer with any specificity. Year-to-date, the S&P 500 is down 22.90%, officially entering a bear market, defined as being down more than 20 percent from its highs. This is the first bear market since the COVID-19 drawdown; however this sell-off feels different given current inflation pressures, economic growth, and the actions of the Fed. Looking at history to try and determine what inning of the decline we may be in, you get a mixed picture, forcing investment professionals to analyze it from many different angles. For context, the average drawdown in the S&P 500 since 1970 is 11.88%.1 If you look at the previous 12 bear markets in the S&P 500 since World War II, the average drawdown has been 33.7%, lasting approximately 385 days. As for the maximum and minimum drawdowns, there have been three bear market drawdowns of over 45%, most recently during the Great Financial Crisis. We have also had three bear markets where the drawdown was less than 25%. According to data from Goldman Sachs, the average peak to trough decline in the S&P 500 during recessions is 30%. However, if you isolate that to only look at situations where there was a recession and a bear market concurrently, the average decline was more than 34%.
The other part of the equation to look at is the valuation of the S&P 500. As you would expect, after a 20% decline in the S&P 500 Index the Blended Forward P/E (BEst) has come down quite a bit from the near-record levels reached during the COVID-19 rally. However, we would argue that it is still not cheap, especially when trying to use that data as a rationale to determine a bottom. The S&P 500 is currently trading at P/E of 16.47, below the 10-year median of 17.7. However, it is essentially in line with the 10-year median pre-COVID P/E of 16.51. We believe this is a better indicator, given the distortion of the market over the past couple of years.
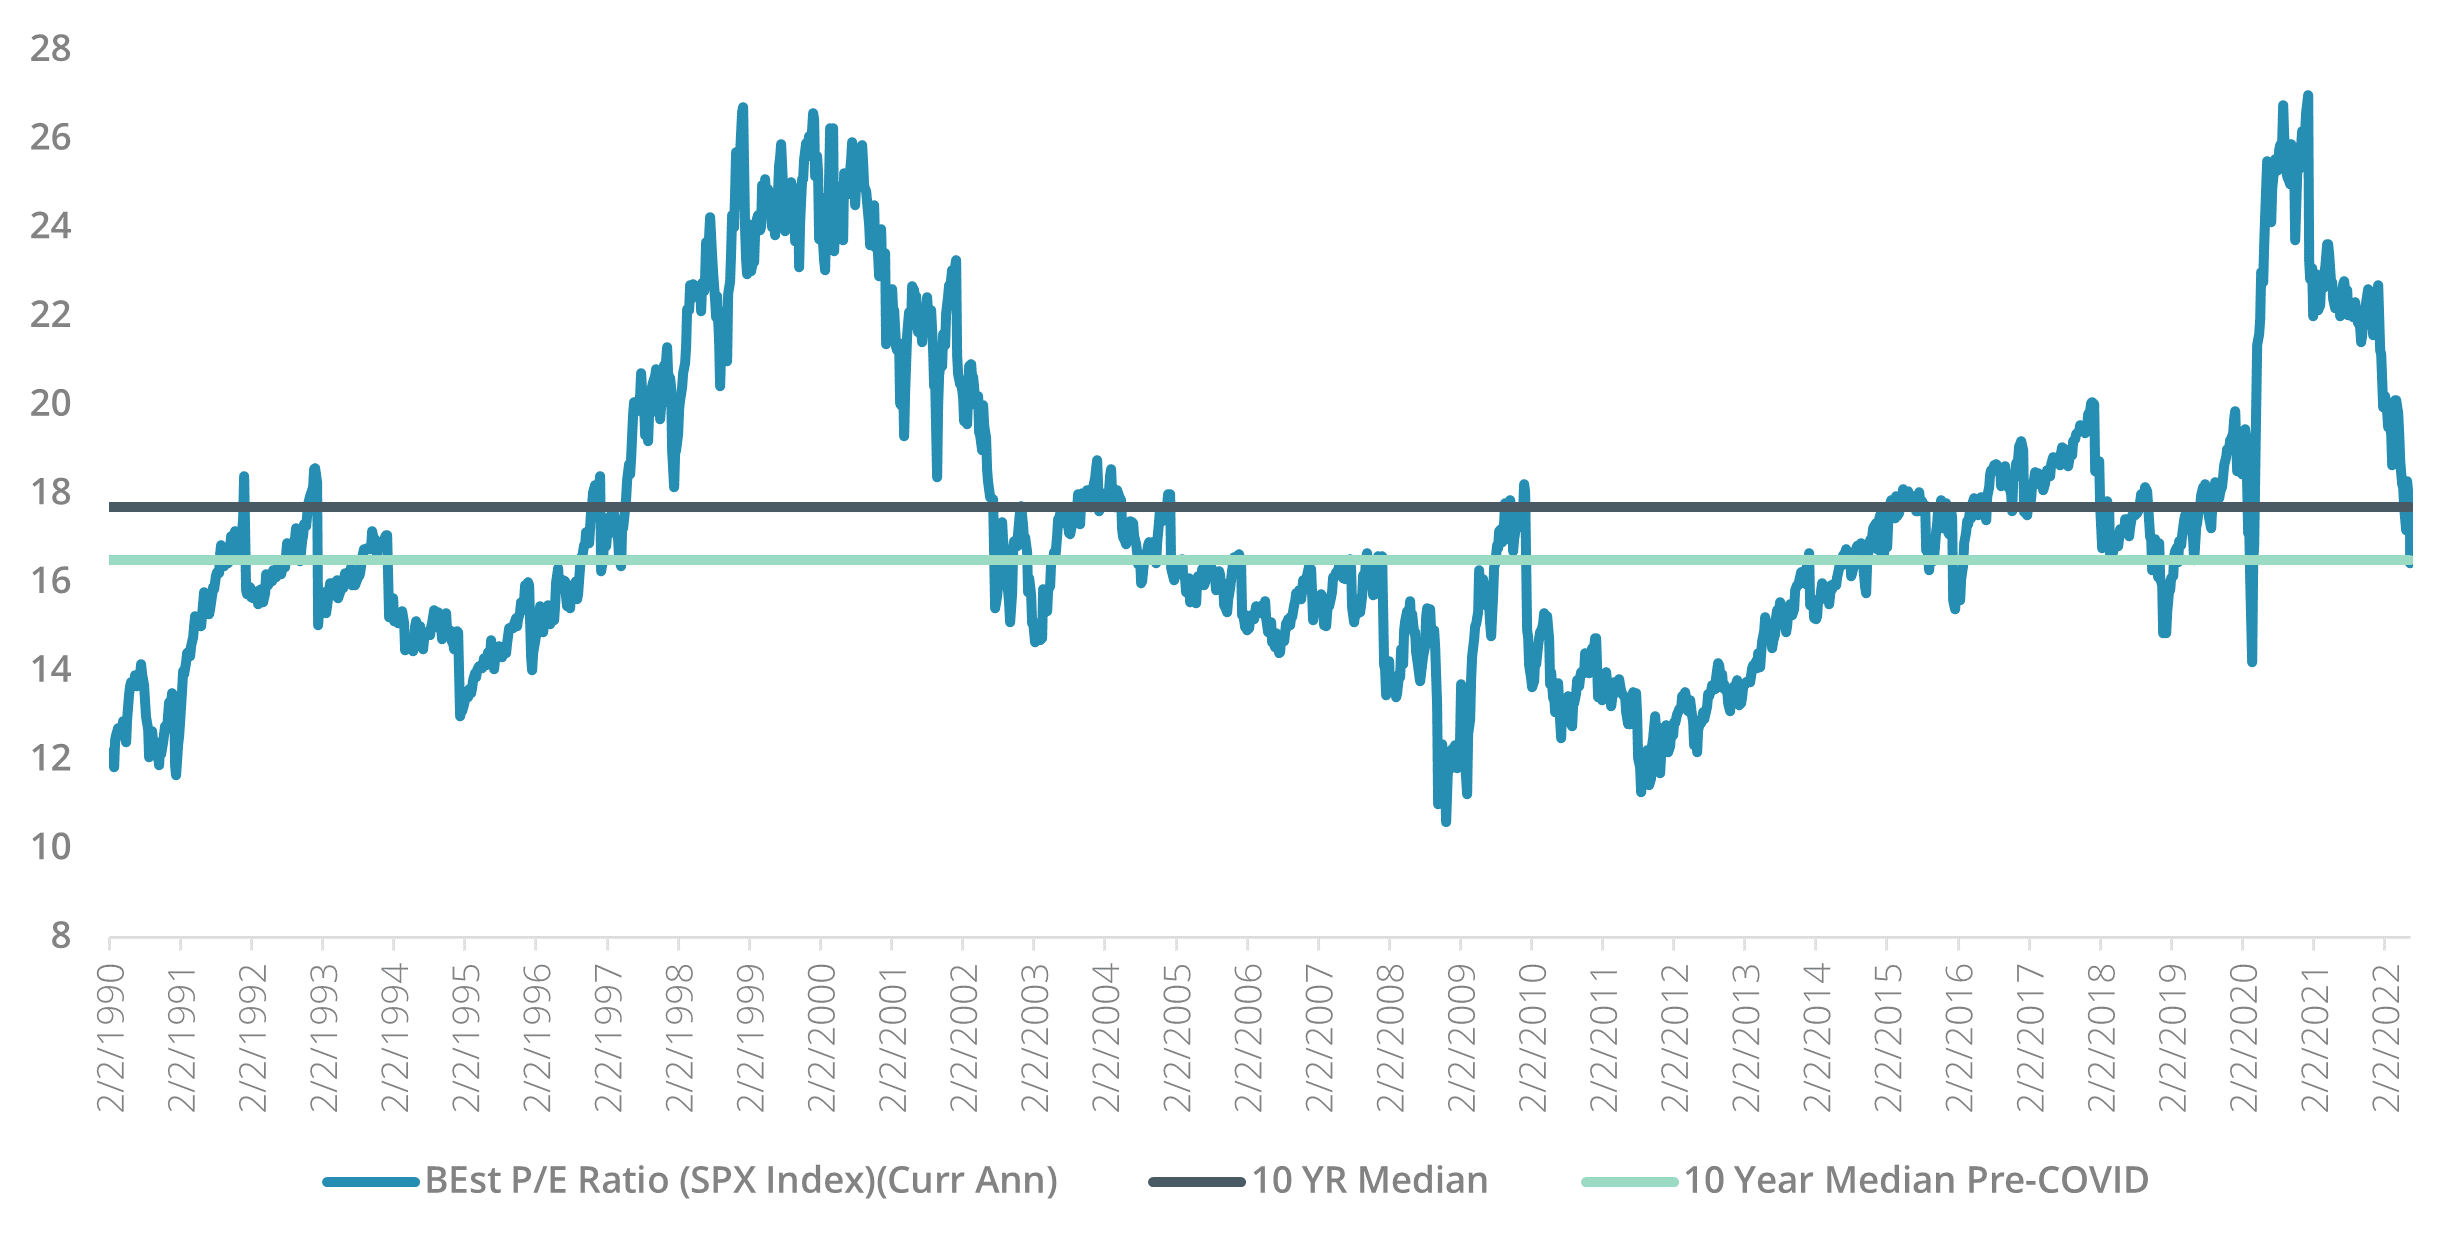
Additionally, while the 10-year median is a good reference point, it is not a hard stop for the market. If you go back to the dot-com bubble and the financial crisis of 2007/2008, the market dropped through the 10-year median P/E during both those periods. Lastly, you also need to consider the earnings component of the P/E ratio assuming, as we do, that inflation and stock market volatility will lead to lower earnings and slower economic growth. If you look at all of the recessions since WWII, the median decline in the last twelve-month (LTM) EPS is 13%.2 Currently, blended twelve-month forward estimates have actually increased over the past several months, and 2023 EPS forecasts are down less than 1%. To us, this indicates that the current forward P/E multiple is a little over inflated.
While we understand this is a lot of data and numbers, we think it is important to provide some context and a basis of comparison for where we are. Our analysis leads us to believe that there is possibly more room and time for this bear market to continue as we are still quite a ways from the average bear market drawdown, and as of June 21, 2022, we are only 169 days into it. However, what we do not want investors to do is to become anchored to those numbers and treat them like the inherent glide path for equities. Markets can swing in wild directions both positively and negatively. Just imagine if you took all the bearish news that was flowing post-COVID lows and made a seemingly rational decision to stay out of the market. An investor would have missed a 40% rally between April 1, 2020, and November 30, 2021. This is why it is so essential, whenever we are experiencing these volatile market conditions, to remember that the key to investing is to focus on the long term. Looking at the previous 81 years, 91.5% of the rolling ten-year periods have been positive.2 As data-driven investors, we have to pose the question: are those odds you want to invest against?
As for how the market environment begins to turn around, inflation is vital. The market is keenly focused on the worst inflation we have experienced in more than forty years. And to us, it makes sense. In order to get a grasp on the direction of interest rates, economic growth, profit margins, and equity multiples the market needs to see that inflation has peaked and ultimately where it will stabilize. However, once we achieve that peak, we believe the market will respond favorably, and fortunately, the data backs this up. Since 1970, following a peak in inflation above 3%, U.S. equities have had a median twelve-month return of 26%.3 You also do not need to see a corresponding increase in economic activity right away, as manufacturing ISM has declined on average over the following six months after peak inflation. While we have gone on record stating that we believe higher inflation will linger longer than was being priced into equity markets back in 2021 and early 2022, we do not believe inflation needs to return to the Fed's target of 2% for equities to begin to deliver positive returns. Instead, we believe the market needs to be approached with a different playbook than the one used over the previous decade.
If The Market Is Declining, Why Don’t You Sell And Increase Your Cash Position?
Anytime there is a drawdown in the market, this is one of the most common questions we receive. As the market declines, it is important to remember we are a long-only investment manager, and on a client's monthly statement, if the market is down 10% for the month, the cash position remains the same. However, we believe that in most instances, anything more than small increases in our cash allocation to stay agile is the wrong decision for our clients. There are a couple of reasons for this thesis. First, let's start with the initial premise that the cash position stays the same. While this might be true in nominal terms, once you adjust that cash balance for inflation and look at its purchasing power, that cash loses value every month. To put some context around that, let us examine the May 2022 CPI report. Headline CPI was up 1% month-over-month and was up 8.6%year-over-year. That means if you started accumulating cash in May 2021 when you began hearing some financial media pundits discuss the Fed being behind the curve on inflation, your cash is now worth 8.6% less. So while yes, that cash balance will be the same on a monthly statement, we think it would be a mistake not to consider the loss of purchasing power in a high inflationary environment.
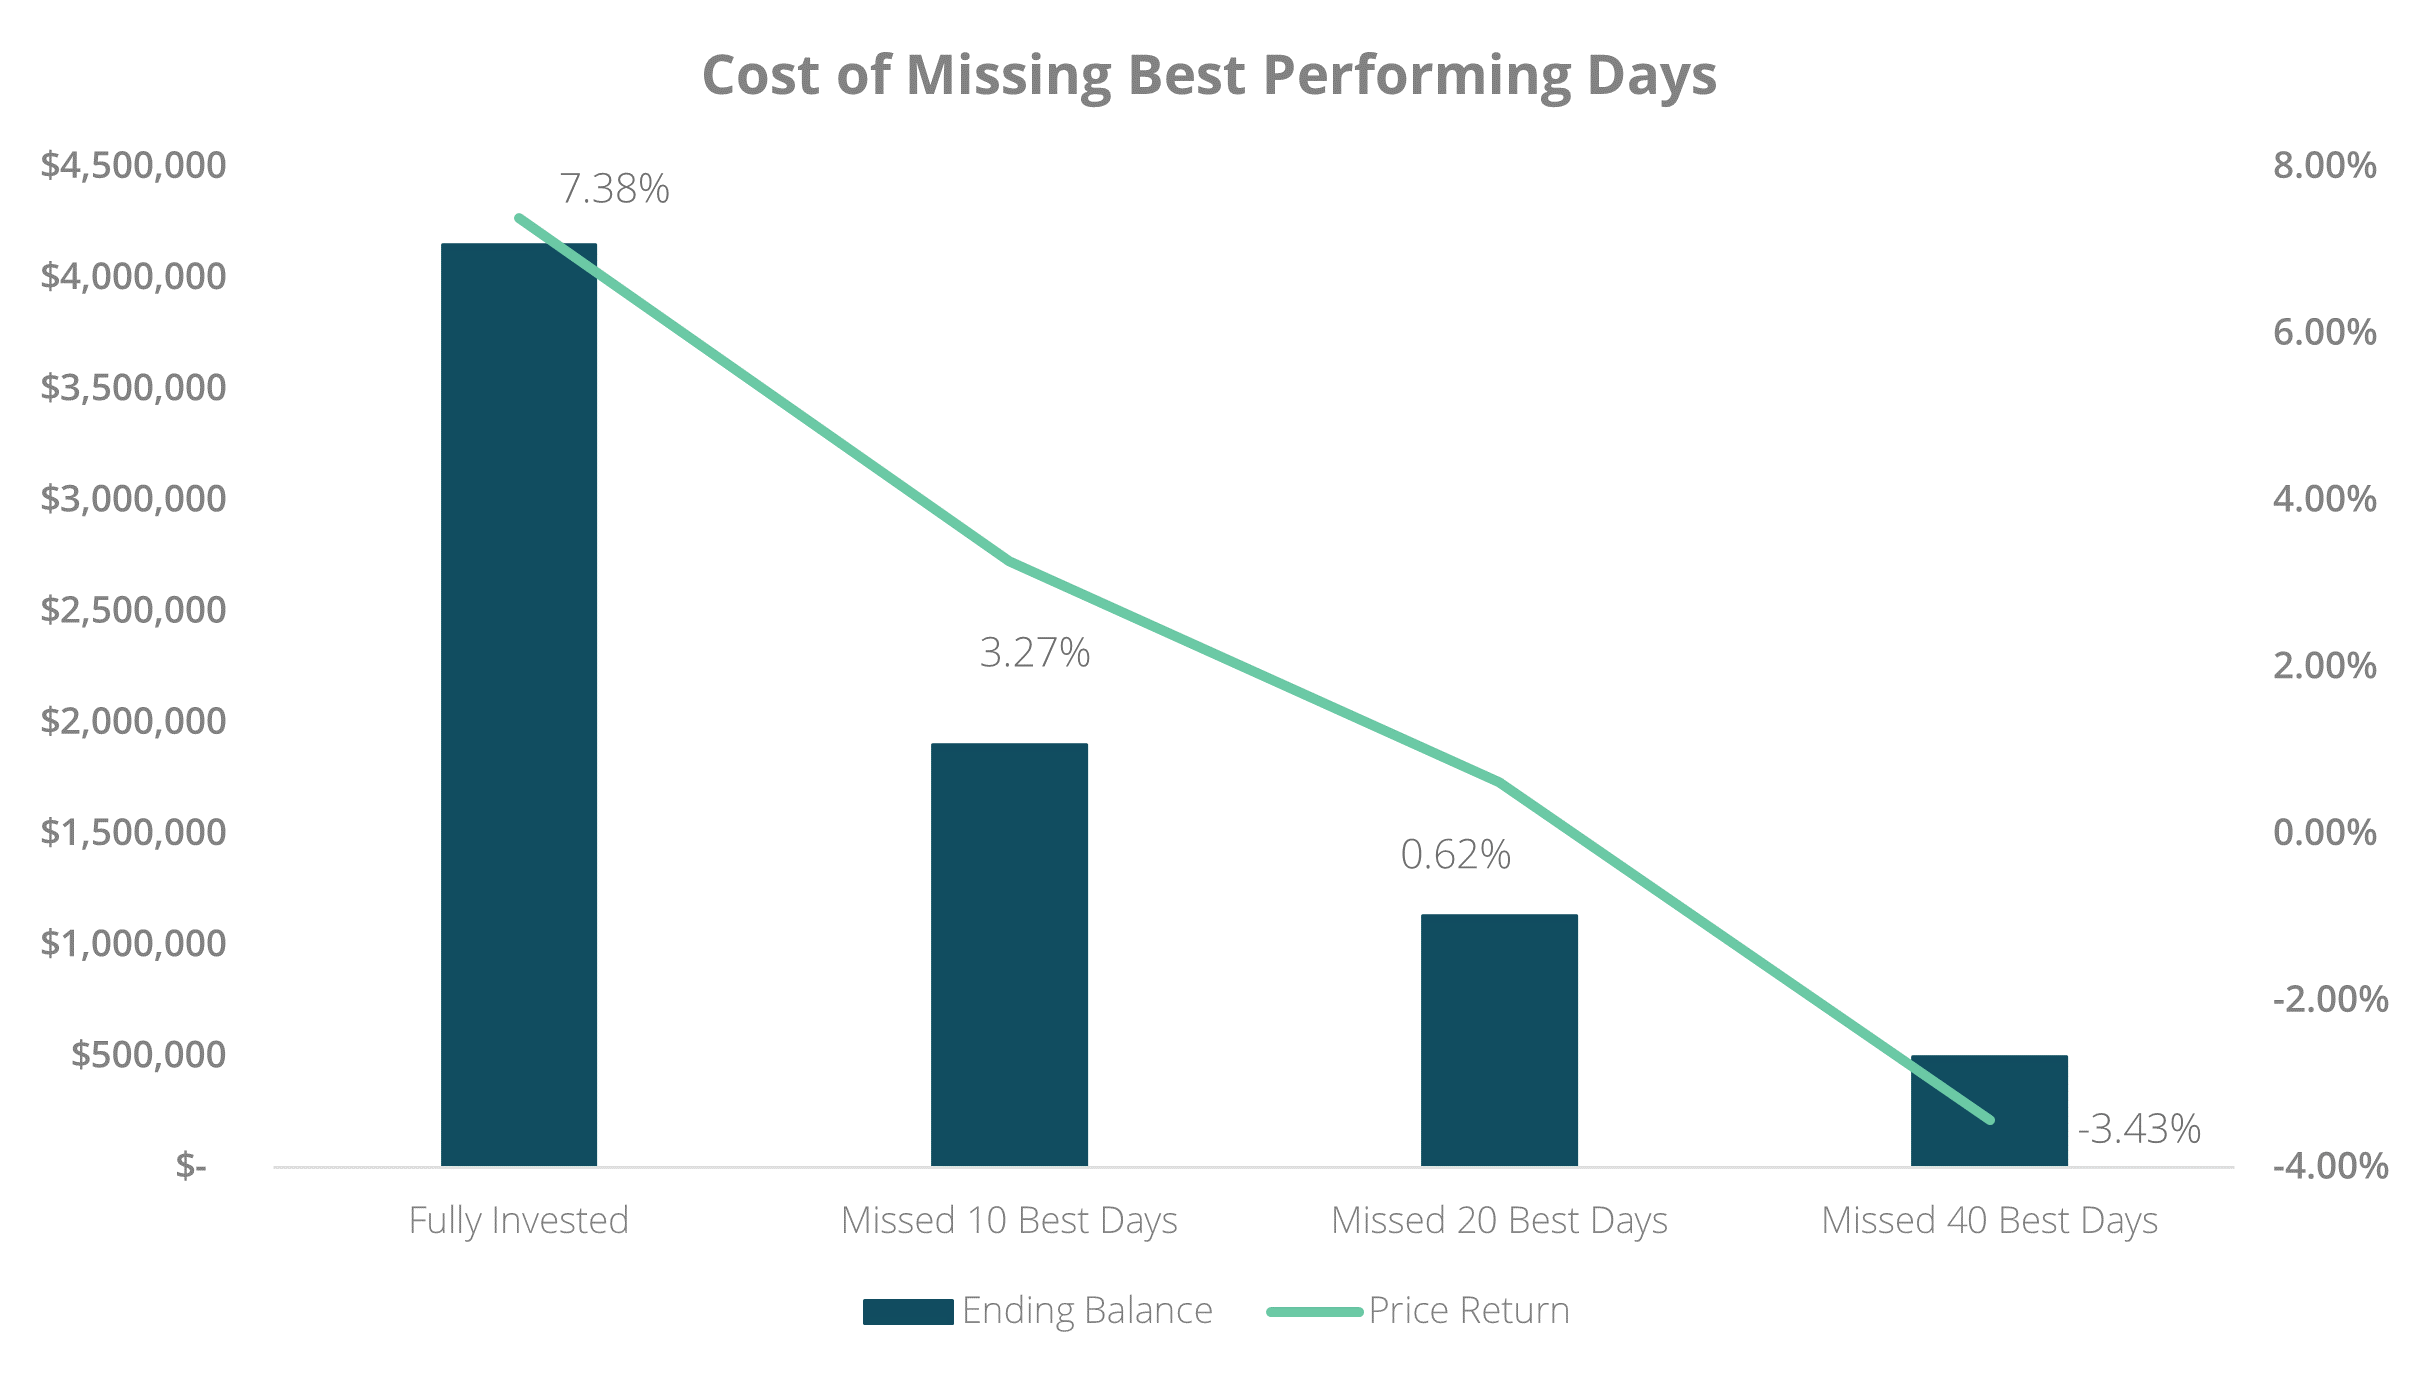
Another key reason we do not believe it is prudent to increase cash balances during every market drawdown is that market timing is difficult if not impossible. Rather, we follow our process of selecting quality companies trading below our calculation of intrinsic value. We then construct our portfolios to reduce drawdowns during these volatile markets, which our strategy has historically done. The downside capture ratio for the MAP Global Equity Composite is 69.36% which means that hypothetically, if the MSCI ACWI is down 10% for the month, our composite has historically been down only 6.936%.4 We believe this is a much better approach than trying to time when to get out of and back into the market. In fact, if you missed the ten best days in the S&P 500 between December 31, 2001, and December 31, 2021, your annualized return was just 3.27% compared to 7.38% if you stayed fully invested. If you missed the best 20 days during that period, your annualized return was just 0.62%, and if you were unfortunate enough to miss the best 40 days, you lost money over the past twenty years. To further cement this point, more than half of the S&P 500's best performing days since the year 2000 have occurred during a bear market, while another 22% took place in the first three months of a bull market.2 While some very sophisticated investors might believe they can make those timing decisions, we would approach it with a proven and repeatable investment process that does not risk missing out on those days and suffering the long-term performance degradation that follows.
How Should I Position My Portfolio For The Current Market Environment?
After reading thus far, this may seem like a leading question. However, it is the basis of a lot of the conversations we are having now with investors from all backgrounds, including institutional, financial advisors, and high-net-worth individuals. While the S&P 500 just entered a bear market, the stocks that have really led the market over these past couple years, growth stocks, have been in a bear market since March. The Russell 1000 Growth ETF is down 30.66% year-to-date, but as many growth investors know, that number masks the carnage in growth stocks. Within the Russell 1000 Growth Index, there are 62 securities that are down more than 50% year-to-date.5 Some of the COVID pandemic “rally darlings” are down almost 70% this year, including Netflix, Peloton, Unity Software, Rivian, Wayfair, and Carvana. If you go back to their all-time highs, this list starts to add names such as Zoom, Shopify, Affirm, and PayPal, which are down more than 70%. If you think we are just cherry-picking individual names, Goldman Sach's Unprofitable Tech Index is down more than 50% year-to-date; and the De-SPAC ETF (Ticker: DSPC), which follows a basket of securities that came public through the Special Purpose Acquisition Company (SPAC) route, is down 62%.6 This sell-off has been very broad-based in many areas of the market that we believe went from investing to speculation (almost gambling even). It is unfortunate we highlight these 50% and 70% thresholds because investors who ignored fundamentals and bought near their respective highs now need these positions to either double or triple to just reach breakeven. It Is because of that and the behavioral biases we mentioned at the beginning of this thought piece, that we are constantly talking to investors wishing to double down on these growth stock portfolios waiting for the tide to turn. The hard truth, however, is that we believe the playbook has changed substantially.
The post-Global Financial Crisis bull market was defined by three key things: low interest rates, quantitative easing, and low inflation. We have spoken about these topics numerous times in the past, but the one we want to highlight here is inflation. As we discussed above, inflation has changed the investing landscape and will play a much more significant role in the years ahead. We had more than a decade when inflation and inflation volatility were non-factors. As you can see from the chart below, that helped improve sentiment (via P/E multiples) around equities. As inflation volatility declined, investors became comfortable paying higher multiples for U.S. stocks. As inflation volatility increased, investors changed direction, as we saw during the 1970s, 1980s, and late 2000s.

Now we are in a market environment where global fiscal stimulus has flooded the economy with cheap money and more debt. Globalization is no longer a deflationary force, and de-globalization is becoming more likely given the geopolitical tensions around the world. Supply chains built to reduce inventories to the bare minimum in a just-in-time world are being flipped on their head for a just-in-case model. Our hard asset base is incapable of meeting our current demand after years of investors pushing companies to reduce their capital expenditures. Finally, the end of cheap Wall Street money that was instrumental in keeping the prices of energy and consumer services low by initially flooding shale patches around the country with inexpensive capital and venture capitalists willing to pump startups with cash to let them offer services such as ride-sharing, food delivery and streaming far below market rates. You tie all of this together with the unprecedented disruptions we have had from the COVID pandemic and now the Russia-Ukraine War, and we believe you have the perfect recipe for sustained inflation over the next five to ten years.
Given that forecast, we think the playbook is shifting to one favoring active investing over passive investing as low rates and quantitative easing will no longer act as a rising tide lifting all boats. The market will shift to favoring fundamentals, cash flows, and achievable growth forecasts over speculation. And finally, a market that favors value stocks over expensive growth stocks, which have had an unprecedented run since 2010. In fact, if you look at the Russell 3000 Growth Index versus the Russell 3000 Value Index, the rolling ten-year annualized performance divergence was more significant than during the dot-com bubble. This is why when we hear investors clinging to their beaten-up growth stocks, we urge caution because even though they are down substantially, they are still not cheap relative to value stocks.
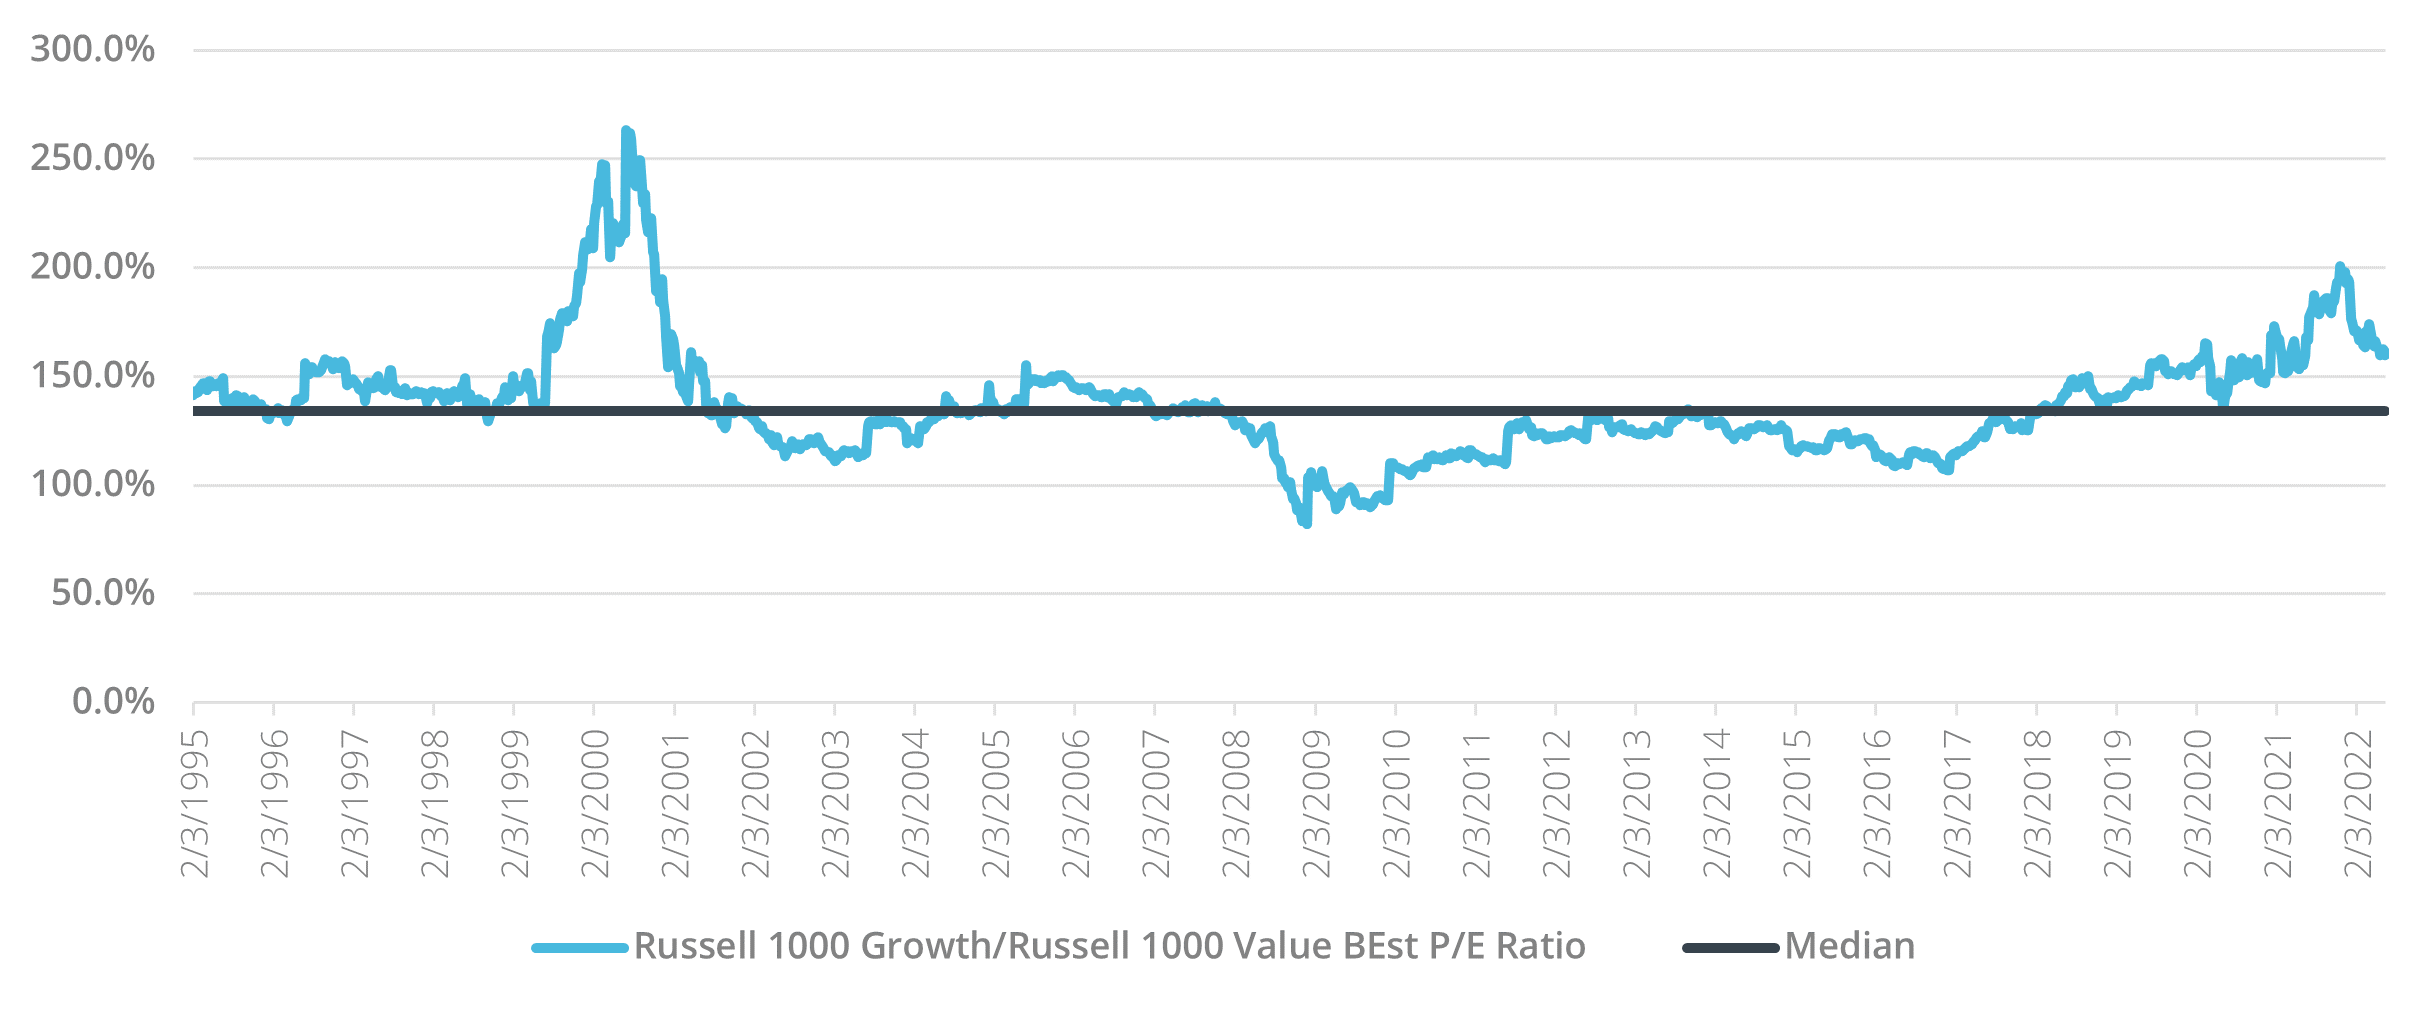
Using the Russell 1000 Growth Index and Russell 1000 Value Index as proxies for growth and value stocks, growth stocks are still trading at a significant premium to their value counterparts. As you can see in the chart below, the ratio of the Blended Forward P/E (BEst) to the Russell 1000 Growth Index over the Russell 1000 Value Index is at 164% compared to the 10-year median of 133.9%. That is more than a 19% premium relative to its mean. If we look at the Price/Sales (P/S) multiple, it is a very similar picture. The Russell 1000 Growth/Russell 1000 Value P/S multiple ratio is 226% compared to a 10-year median of 176%.2
The problem for growth stocks is two-fold. First, they became very expensive reaching the highest relative valuation levels since the dot-com bubble. This is a critical point because, as value investors, we understand the vital role that growth plays in a company's valuation. The problem was that investors started using unrealistic growth assumptions and paying too much for that growth. During the past two years, growth stocks trading with P/S multiples of 20 or 30 were not rare. This is why we keep interchanging the words growth and expensive. Because when stocks with good growth prospects trade at substantial discounts to their intrinsic valuation, they can and should be in the investable universe of value investors.
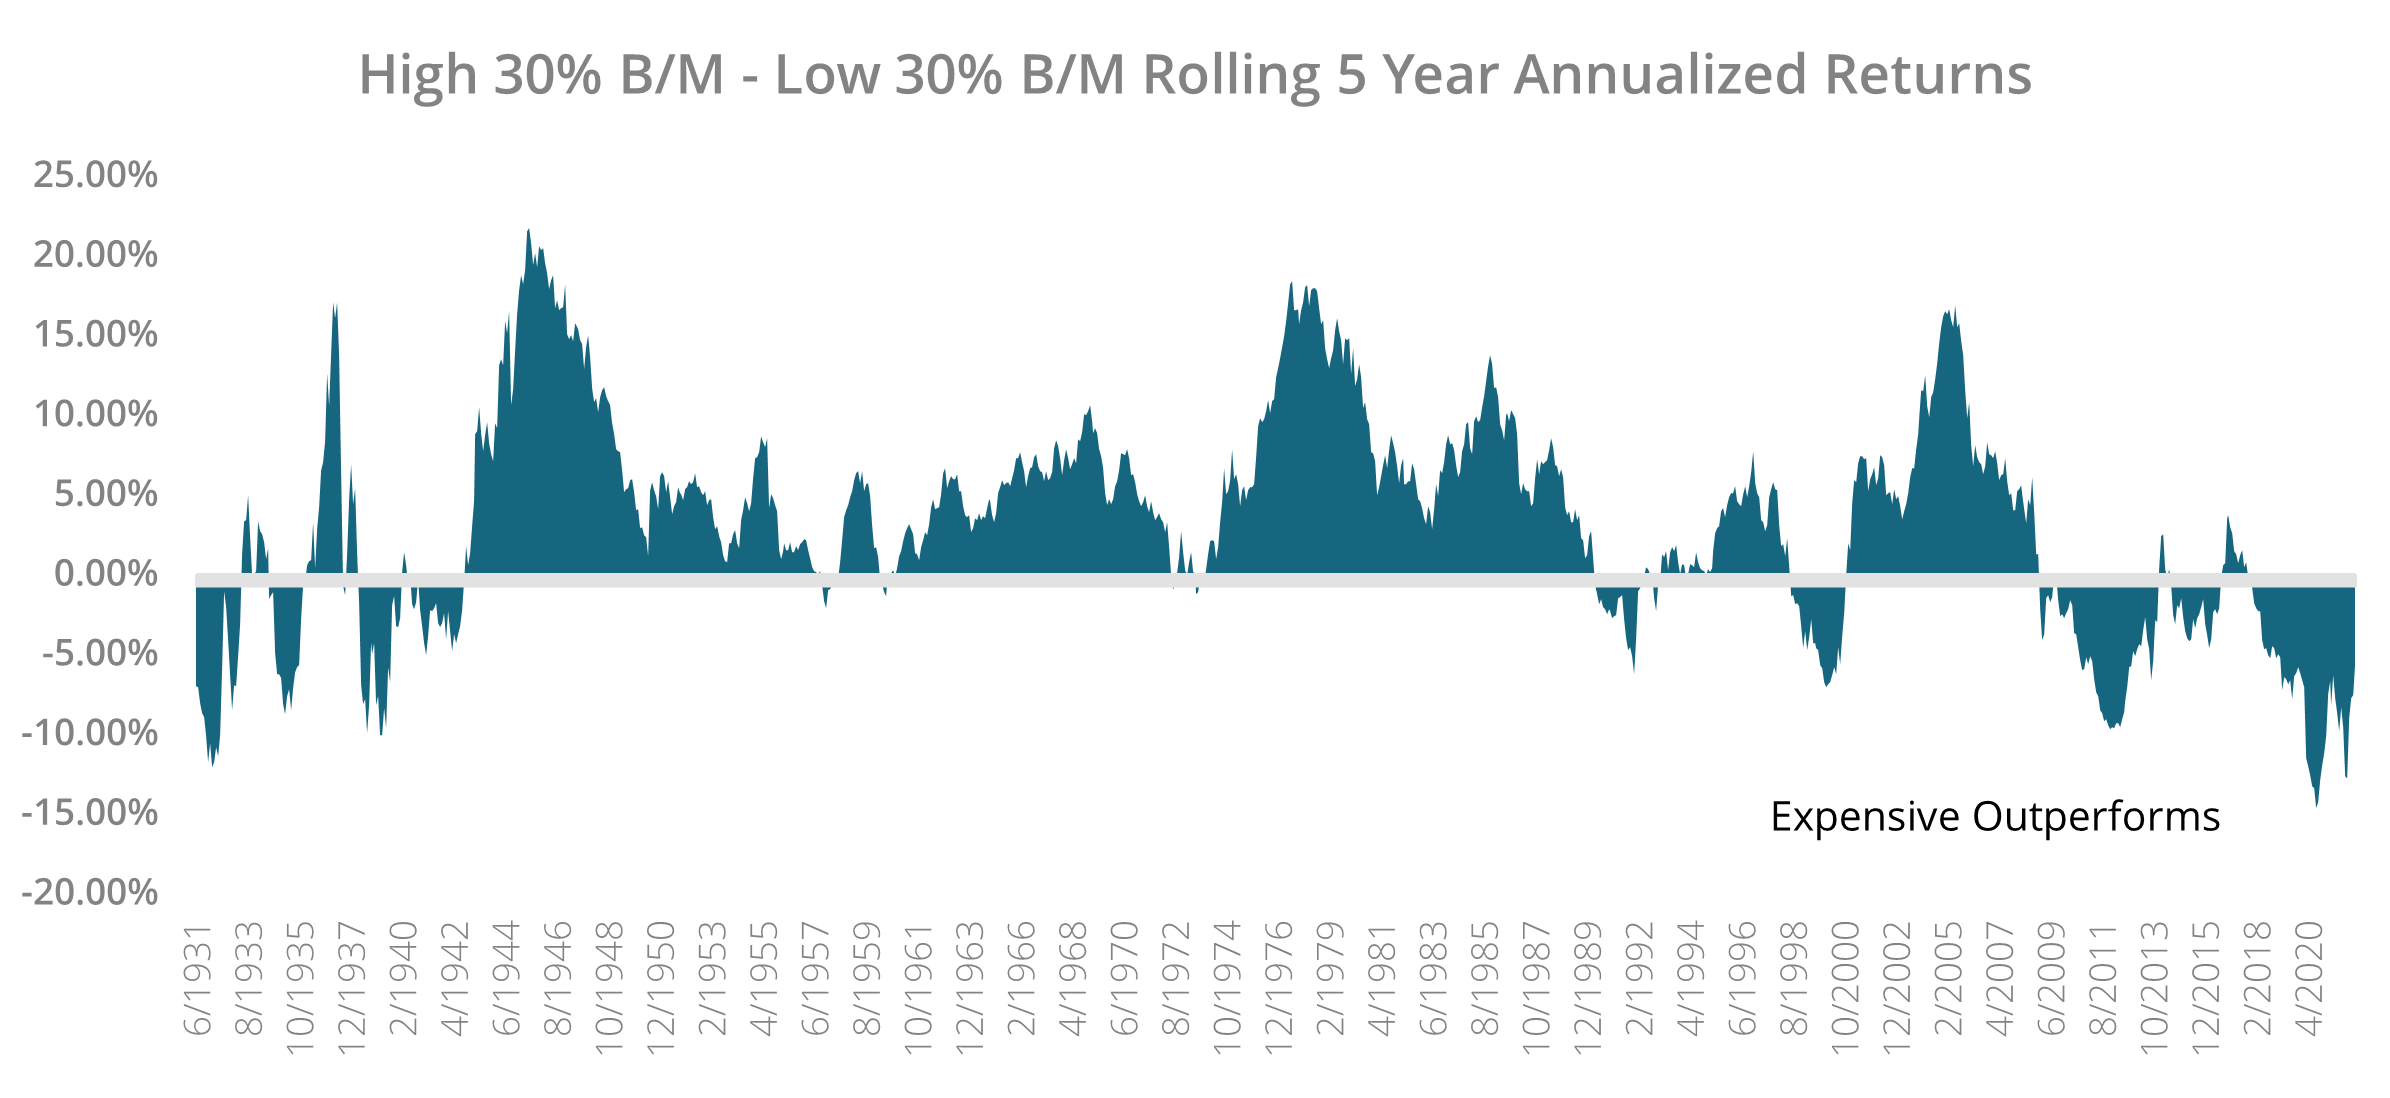
The other problem for expensive stocks is that we are in an inflationary environment that has traditionally benefitted value stocks. Let's start with what we referenced earlier. We believe the key to the market right now is getting through peak inflation, which has historically been a tailwind for equities over the next twelve months. Diving a little deeper, we analyzed how value stocks performed relative to expensive stocks in the five years after inflation peaked above 3%. We utilized the high and low 30% Book/Market stocks in the Fama-French database (an asset pricing model that expands on the capital asset pricing model by adding size risk and value risk factors to the market risk factors).The results heavily favor value stocks. Since 1950, the average five-year annualized return for value stocks as defined above was 14.76%, compared to 10.24% for so-called expensive stocks. Of the 12 peaks in inflation above 3% since 1950, value stocks outperformed growth stocks over the next five years on ten of those occasions. In situations where peak headline inflation would be equal to or more than where we are at right now (8.6%), value stocks had an average five-year annualized return of 24.9%, compared to just 16.2% for expensive stocks. As we have stated in previous thought pieces and presentations, value’s outperformance over expensive growth makes sense. When inflation increases, interest rates follow along, which translates into higher discount rates. Companies that are dependent on cash flows far ahead in the future (i.e., expensive growth companies) are going to be more negatively impacted by that shift. Similarly, we have seen that once inflation starts getting above the Fed's target, it can be challenging to bring it back below in a timely manner.

This idea highlights another critical aspect of our favoritism toward value stocks over their expensive growth counterparts; these cycles tend to be measured in years, not months or quarters. Just think back to the dot-com bubble; it took the NASDAQ Composite more than fifteen years to retake its all-time highs. However, that long period of underperformance then led to expensive/growth stocks outperforming value stocks during the latter half of the 2010s even more than they did during the dot-com bubble. Conversely, if you go back to the 1970s, value stocks rolling five-year annualized returns outperformed those of expensive stocks from 1974 to 1990 as the Fed was constantly dealing with the threat of higher inflation, and once it was gone, the threat of it returning.7 This has been a common theme throughout economic history and in equities over the past 100 years, as you can see from the chart below. Unfortunately for those wrongly positioned, we believe we are entering another one of these cycles.
Conclusion
We have officially entered a bear market. Unfortunately, if you turn on the TV, radio or read almost any online publication, you have undoubtedly seen this many times. Stock market volatility and bear markets are a way to drive clicks and push narratives. However, staying committed to your investment process and avoiding the emotional pull of seeing the market down over time is critical. One of the biggest mistakes investors make is selling too soon and getting back in too late. Investing is a long-term process that, as we mentioned, over rolling ten-year periods, has been positive 91% of the time. By trying to time the market, investors tend to miss some of the most significant daily gains, which can negatively impact their performance for years to come. While inflation will cause some pain in the economy as the Fed attempts to put it back in the bottle, once we have gotten past an inflation peak, we believe equities will have positive performance in the years ahead. Furthermore, a playbook centered around value stocks has demonstrated the ability to deliver alpha during periods of high inflation. If investors follow a data-driven process that helps them avoid some of the emotional and cognitive biases that can develop during these volatile drawdowns, we believe the year ahead should prove fruitful.
We welcome your comments on this piece and would be happy to provide more detail on our thoughtful, research-driven investment process. For further information, please email us at [email protected].
Managed Asset Portfolios Investment Team
Michael Dzialo, Karen Culver, Peter Swan, John Dalton, and Zachary Fellows
June 2022
Certain statements may be forward-looking statements and projections which describe our strategies, goals, outlook, expectations, or projections. These statements are only predictions and involve known and unknown risks, uncertainties, and other factors that may cause actual results to differ materially from those expressed or implied by such forward-looking statements. The information contained herein does not represent a recommendation by us to buy or sell any security or securities. Managed Asset Portfolios, our clients and our employees may buy, sell or hold any or all of the securities mentioned. We are not obligated to provide an update if any of the figures or views presented change. Past performance is no guarantee of future results.
Sources:
1 Morningstar Direct as of May 31, 2022
2 Bloomberg as of June 17, 2022
3 Goldman Sachs Global Investment Research
4 Morningstar Direct as of March 31, 2022
5 Bloomberg data using Russell 1000 Growth ETF (Ticker: IWF) as of June 10, 2022
6 Bloomberg data using The De-SPACETF(Ticker: DSPC) as of June 17, 2022
7 https://mba.tuck.Dartmouth.edu/pages/faculty/ken.French/data_library.html

