

Bonds and The Federal Reserve's Conundrum
Jun 03, 2022U.S. Fixed Income Is Enduring One of The Worst Declines in History
Fixed income investors will look back fondly on the 40-year bull market for bonds that ended in 2021. We’re in an entirely different market now, and while early, it’s the one we’ve been warning about for quite some time. The Bloomberg U.S. Treasury Total Return Index declined 5.6% in the first quarter, the worst since the index began in 1973. A May 6, 2022 article in The Wall Street Journal quoted an academic who pointed out that this year, so far, the broad bond market has had the worst return compared to any calendar year since 1842.
Even so, after more than two years of the ten-year treasury remaining below two percent, yield-starved investors might be tempted to lock in today’s relative higher rates. We empathize. Yields are close to six times the 0.52% level hit on August 4, 2020. But we believe there’s still room for yields to go meaningfully higher.
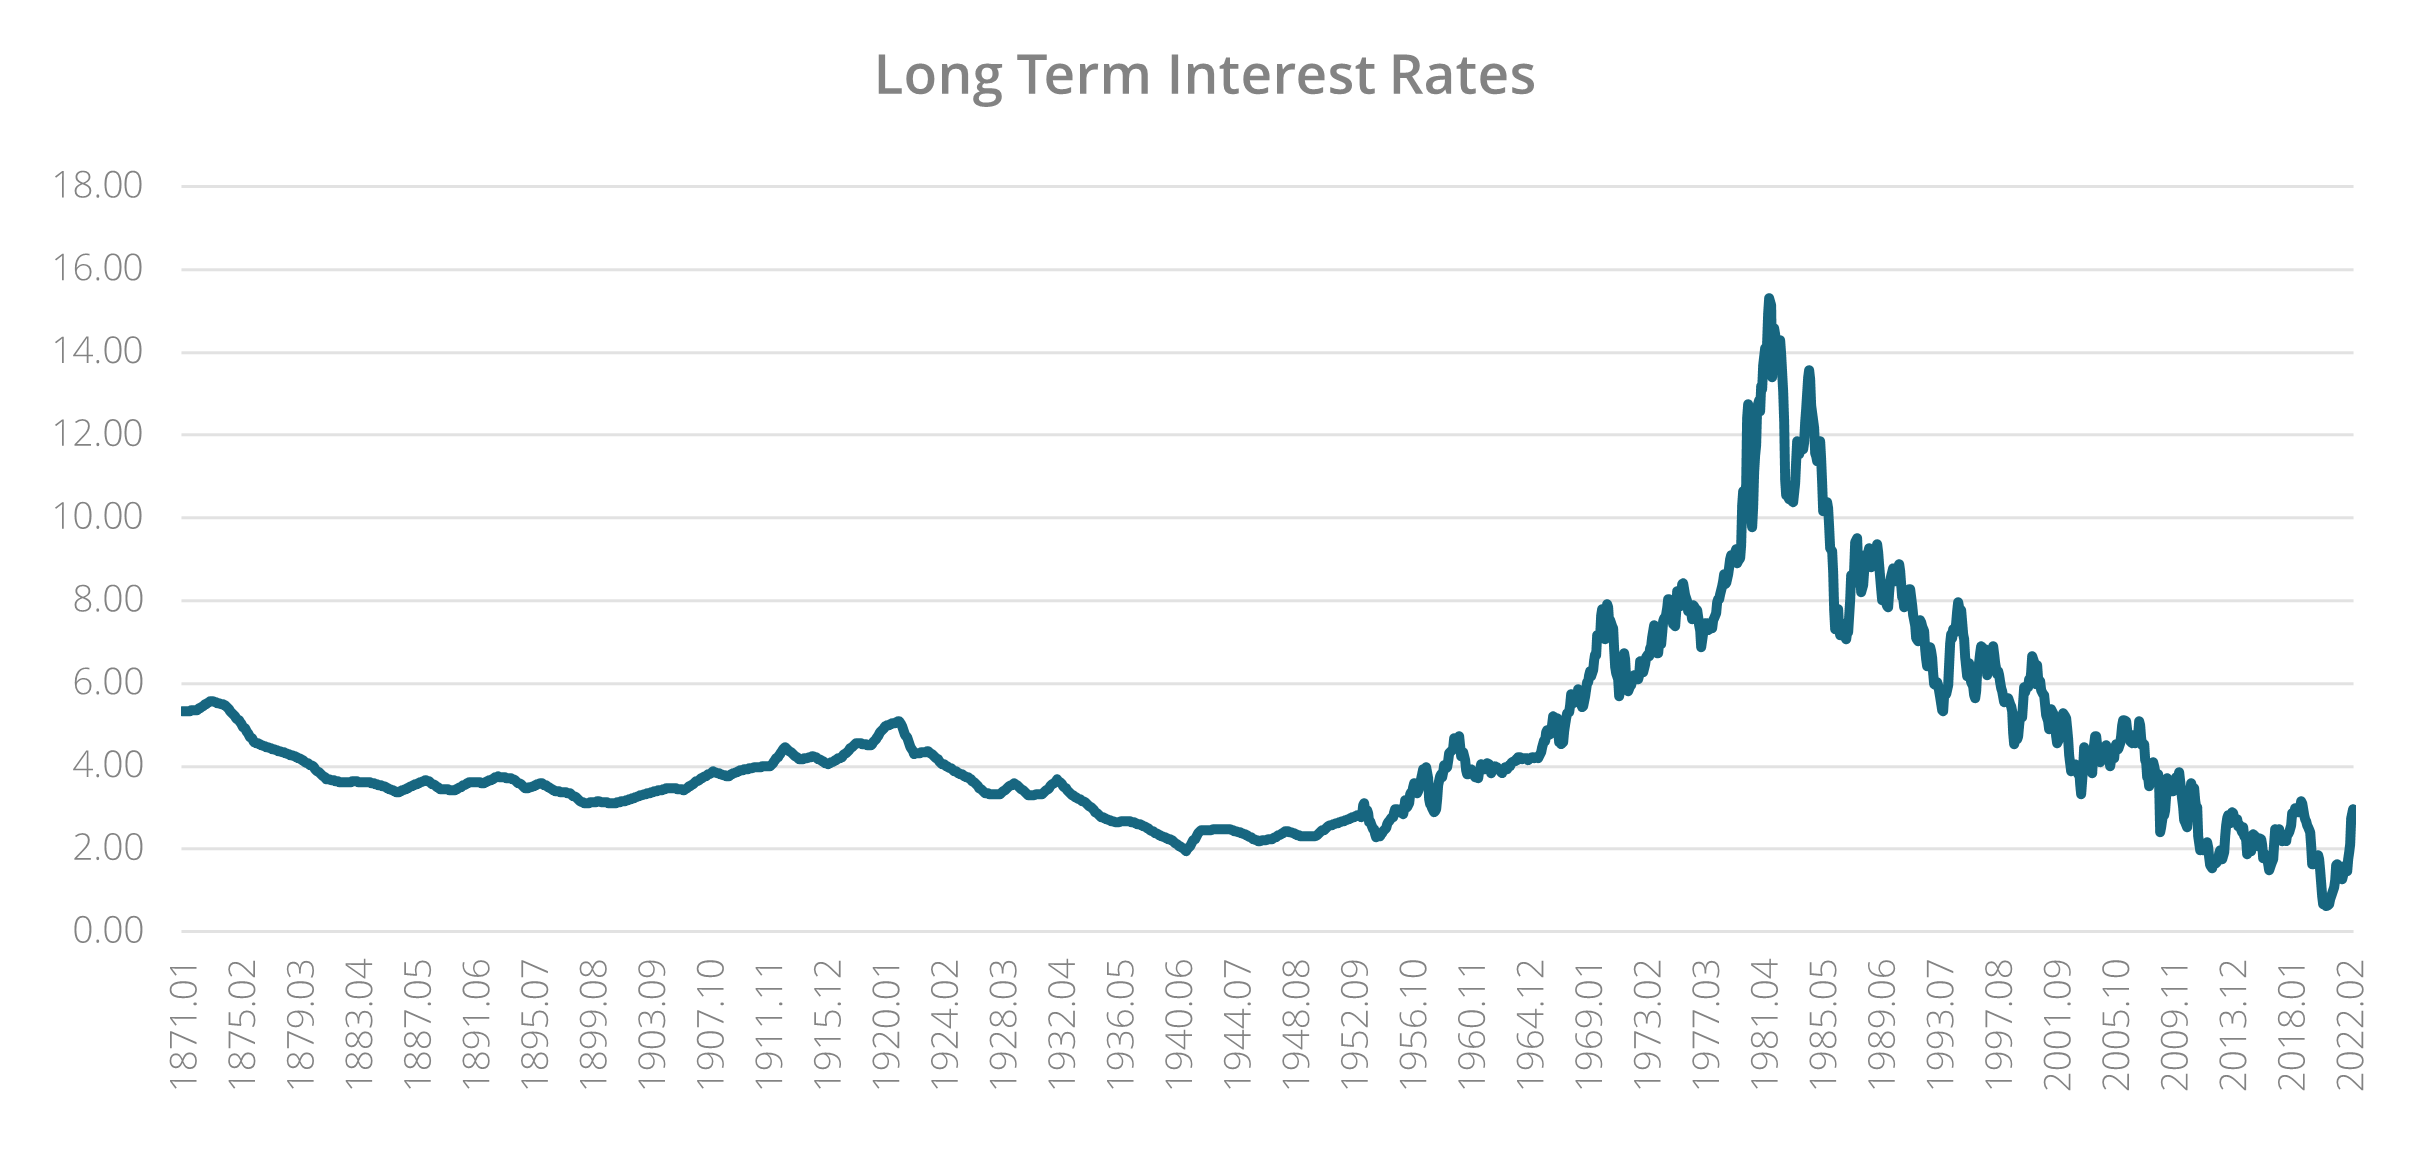
When we look at the chart below, we’re reminded of two things: first, rates are still on the low side of their historical range; and, second, bond market changes tend to occur as part of larger cycles. Going back to 1871, we observe five significant cycles in long term interest rates: there were bull markets from 1871-1900, 1921-1940, and 1982-2020, and bear markets between 1900-1921 and 1940-1982. Unfortunately, we believe we are entering one of these protracted cycles for long term interest rates.
Some investors are choosing to ignore this and believe we have already reached peak inflation. Moreover, they believe that are emergence will follow into a period of (mostly) tame inflation. However, as we will describe below, we think the inflation outlook is much cloudier over the intermediate term. With real rates still close to zero, we don’t believe investors are being adequately compensated for taking this risk.
The Federal Reserve (Fed) Faces Two Unappealing Choices
The Fed’s stance has come a long way from when it described inflationary pressures as “transitory” back in April 2021 and kept the Fed funds rate at 0-0.25%. In its latest statement, the Fed described inflation as “elevated, reflecting supply and demand imbalances related to the pandemic, higher energy prices, and broader price pressures,” and confidently concluded that, with further increases in rates; it could achieve full employment and reduce inflation to its targeted 2%.
The bond market’s willingness to accept yields far below inflation implies a consensus expectation for either a recession or slower inflation. We think otherwise. We expect the Fed will continue to favor full employment over combating inflation, reasoning that most people prefer being employed over having stable prices but no paycheck.
Though it’s certainly possible the Fed will smoothly pilot the economy to a soft landing, history suggests otherwise, and we aren’t as sanguine as the Fed and bond market appear to be. We see both transitory and structural issues driving inflation. Transitory issues such as supply chain snarls and energy prices may ease on their own or with modest intervention, but we’re more concerned about structural issues such as rising wages and real estate prices. We don’t see any quick fixes for higher agriculture prices either, as food demand is relatively inelastic to prices.
Unfortunately, our economy isn’t strong enough for the heavy hand needed to bring inflation back to that 2% target. Excluding inventories, gross domestic product (GDP) in the fourth quarter was only 1.9%, and first quarter real GDP was -1.4%. This might be the weakest economy at the initiation of any Fed tightening in history.
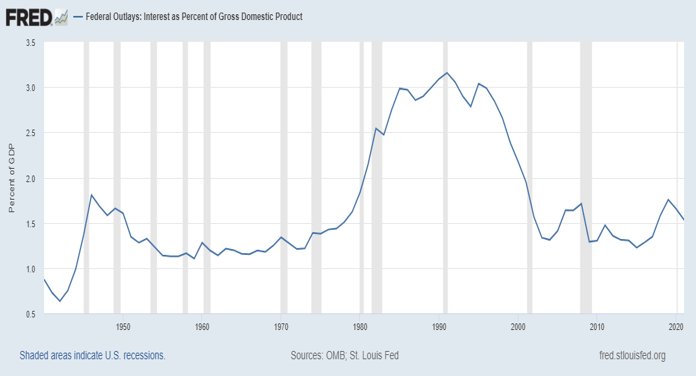
In addition to economic weakness, we have a government debt problem that will worsen with higher rates. We’ve expressed our concern about our government’s heavy indebtedness in past MAP Views. The pushback was always that rates remain low and the cost to service that debt is lower than ever. However, that is set to change as the Fed raises rates with a U.S. federal debt to GDP level of 124% as of Q1 2022. As of 2021, the U.S. government spent 1.53% of its GDP on interest costs, which is within the historical range. But that was with the Fed funds rate at zero and the ten year Treasury around 1.5%. Currently, the ten year yield is hovering around 2.80%, and the Fed funds rate is expected to end the year at over 2.5%.
This is going to put the U.S. government in a precarious situation. The interest cost level relative to GDP is going to rapidly approach levels last seen in the 1980's, as the current cost of the national debt is only 1.4%. Suppose that number doubles over the next couple of years as current issues mature and the government continues running deficits. In that case, we estimate interest outlays will exceed $700 billion, a figure higher than the current outlay for Medicare and approaching the cost of our defense budget.
We are not suggesting that this will push us into a significant recession. However, the ever-increasing debt service narrows the government’s ability to fund necessary infrastructure investments and innovative projects, which will dampen the growth of an economy that’s already growing too slowly.
After waiting too long to rein in an overheated economy, we suspect there are too many unpredictable variables for the Fed to easily balance its dual mandate of full employment and stable prices. It must now choose between the two equally unappealing prospects. One is pushing our fragile, slow growth economy into recession or, as we currently project, permitting inflation to run far higher than its stated 2% long term target for possibly several years.
Examining Interest Rate Risk
Given the persistent threat of higher inflation over the next couple of years, it’s essential to evaluate how rate moves can impact fixed-income holdings. Most investors understand the inverse relationship between interest rates and bond prices: as rates go up, prices of fixed interest rate bonds tend to go down. But that’s not enough. We also need a reasonable idea of just how much exposure a bond or fixed income allocation has to changes in interest rates, especially since there are likely several rate hikes yet to come.
Bond holders often use the time to maturity to quickly indicate rate risk. As crucial as it might be to know when it will be time to reinvest the face value of a bond, the maturity date is only part of the picture, because it only considers principal. Most bonds pay regular interest that can be reinvested at potentially higher rates. In a volatile rate environment, we use effective duration to judge the riskiness of specific bonds because it provides a better measure of a bondholder’s cash flows than maturity. Duration, as defined, accounts for both interest and principal timing and gives a better estimate of price risk than time to maturity. A bond’s price change, expressed as a percentage of the current price, is [effective duration] x [expected change in rates]. Let’s illustrate this through a real-world application of duration:
Let’s say you have two corporate bonds with similar coupon payments, one bond maturing June 2047 with a 4.5% coupon and one maturing June 2023 with a coupon of 4.33%. These two bonds have drastically different duration and risk profiles. The 2047 bond has a duration of 14.76 versus a duration of 0.902 for the 2023 bond. Using the formula above, we can see that if interest rates rise by 1%, the bond maturing in 2047 will be down 14.76% versus down just 0.902% for the shorter maturity bond. That is quite a difference and is a critical component of why the traditional 60/40 portfolio has not delivered the protection clients may prefer in today’s volatile markets.
Our Approach Toward Fixed Income
As discussed previously, we think the market isn’t offering enough yield to offset the risks outlined above. We also believe this inflationary period is different from the late 70's to 80's. We highlight three key points that differentiate that period from today. First, nominal ten year yields were mainly higher than core personal consumption expenditures; second, federal debt to GDP was in the 30% range; and third, at least banks passed out free toasters to entice customers.
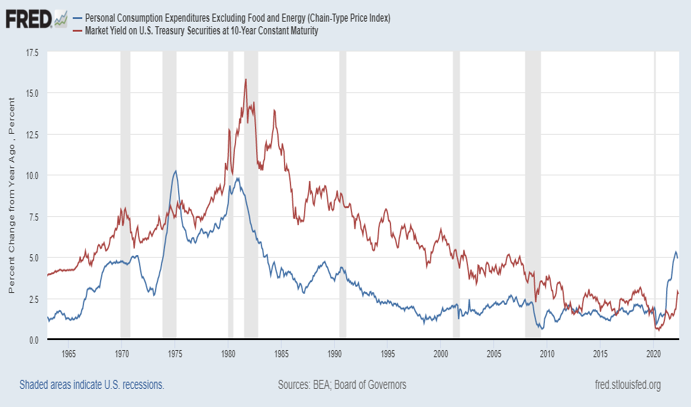
With trailing twelve-month Core Personal Consumption Expenditures at 4.9% and the ten year note recently yielding 2.85%, buying Treasuries now would effectively lock in a loss of purchasing power. Absent enough compensation for risk, we prefer to stay short in our maturities, with a preferred maturity range for our corporate debt of one to three years, substantially lower than our Global Allocation peer group’s median effective duration of 5.47 and our U.S. asset allocation (30-50% fixed income) peer’s median of 5.37.1
We have been averse to extending duration for years, which has had a negative impact on our performance until recently. We thought the fixed income bull market would have ended after the Fed initiated quantitative tightening in October 2017. However, the COVID pandemic was a Black Swan event that shocked the world and forced the Fed to take drastic actions. And, ultimately, the underlying fundamentals didn’t change. If anything, the monetary and fiscal response added to the strength of our convictions.
As indicated by the bond market’s performance this year, our concerns were well-founded. Performance-enhancing opportunities still exist, but finding them demands the same selective and rigorous scrutiny we apply to equities. Our bottom-up process identifies bonds that are likely more secure than their ratings and yields suggest, which positions our clients for upside without accepting undesirable interest rate risk.
We welcome your comments on this piece and would be happy to provide more detail on our thoughtful, research-driven investment process. For further information, please email us at [email protected].
Managed Asset Portfolios Investment Team
Michael Dzialo, Karen Culver, Peter Swan, John Dalton, and Zachary Fellows
June 2022
1 Morningstar Direct data as of June 2, 2022
Certain statements may be forward-looking statements and projections which describe our strategies, goals, outlook, expectations, or projections. These statements are only predictions and involve known and unknown risks, uncertainties, and other factors that may cause actual results to differ materially from those expressed or implied by such forward-looking statements. The information contained herein does not represent a recommendation by us to buy or sell any security or securities. Managed Asset Portfolios, our clients and our employees may buy, sell or hold any or all of the securities mentioned. We are not obligated to provide an update if any of the figures or views presented change. Past performance is no guarantee of future results.
© 2022 Morningstar. All Rights Reserved. The information contained herein: (1) is proprietary to Morningstar and/or its content providers; (2) may not be copied or distributed; and (3) is not warranted to be accurate, complete or timely. Neither Morningstar nor its content providers are responsible for any damages or losses arising from any use of this information.

